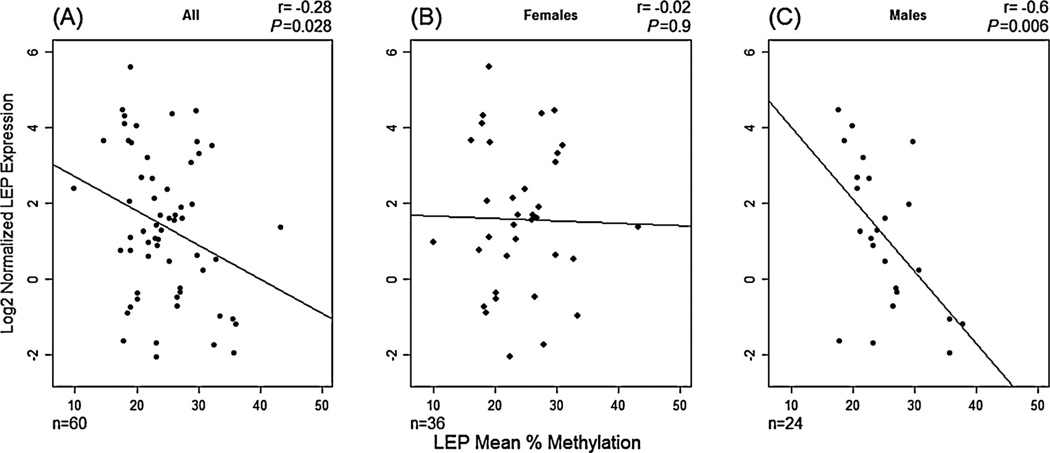
Figure 1.
Relationship between LEP gene expression and LEP mean methylation across 23 CpG sites in human placenta samples. (A) Females and males (n=60), (B) Only female infants (n=36) and (C) Only male infants (n=24). The result of a Pearson’s correlation analysis (r) and its p-values is depicted on each figure.

