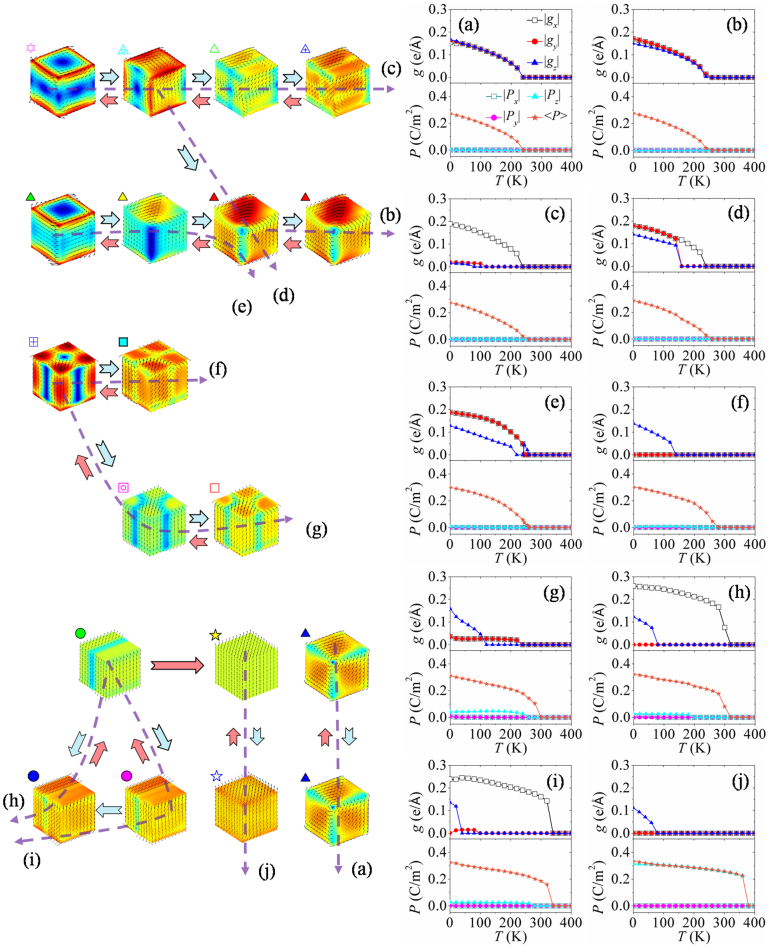
Figure 4. Evolution of toroidal moments and polarizations (right panels) of a nanodot.
In cooling-down process under different charge screening conditions with screening factor (a) β3 = 1, (b) β3 = 0.7, (c) β3 = 0.5, (d) β3 = 0.4, (e) β3 = 0.2, (f) β3 = 0.1, (g) β3 = 0.05, (h) β3 = 0.04, (i) β3 = 0.02, and (j) β3 = 0. Left panels depict the evolution paths of equilibrium domain pattern during cooling-down process (azury arrow) and heating-up process (pink arrow) under different charge screening conditions corresponding to the right panels.

