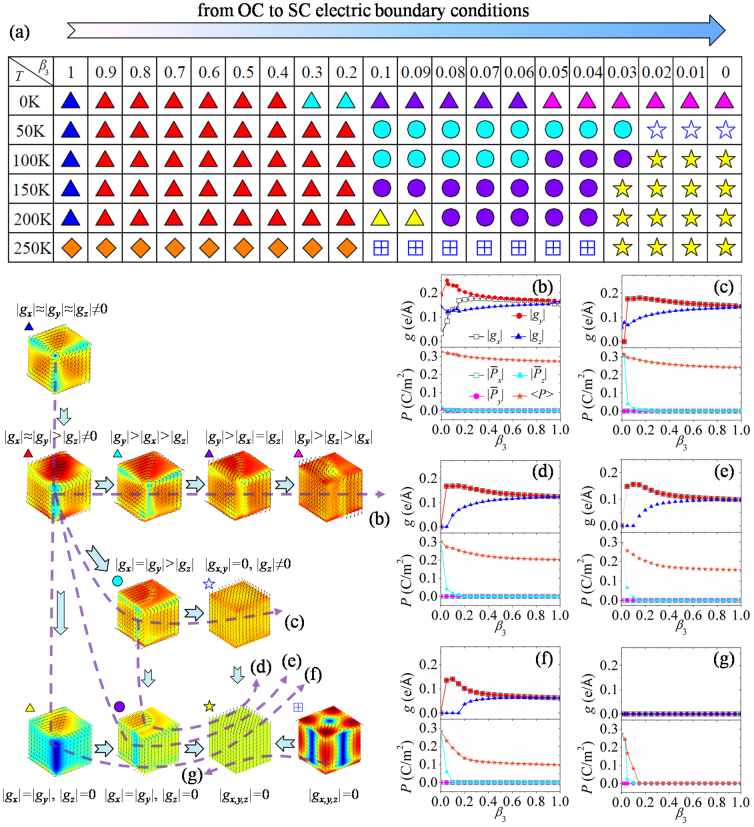
Figure 6. Domain pattern evolution of a nanodot in increasing charge screening process.
(a) Phase diagram of the equilibrium domain patterns as a function of charge screening and temperature. Toroidal moments, polarizations and equilibrium domain patterns as functions of charge screening at the temperature of (b) 0 K, (c) 50 K, (d) 100 K, (e) 150 K, (f) 200 K, and (g) 250 K.

