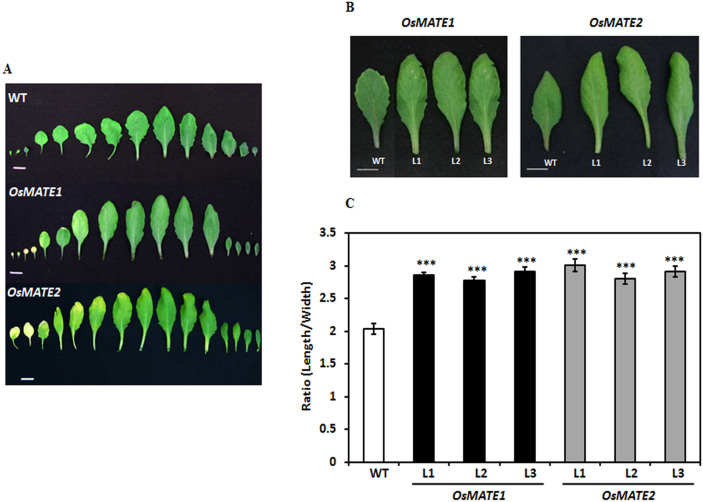
Figure 1. Alteration of leaf morphology in transgenic lines.
(A) Leaf sizes and pattern of each rosette leaf beginning from the oldest one of WT and one line representing OsMATE1 and OsMATE2 transgenic plants. Plants were grown for 4 week under 16 h light-8 h dark photoperiod before photograph. (B) Photograph showing the difference in leaf size (9th leaf of rosette from oldest one) of WT and 3 representative lines of OsMATE1 and OsMATE2 transgenic plant. White line indicates the scale bar (1 cm). (C) Ratio of length and width of leaf (9th position) of transgenic lines and WT. Bars are mean and error bars represent ± SE of 8–10 individual plants. Level of significance was evaluated by One-way ANOVA (Newman-Keuls used as post hoc test). ***Significantly different from WT (P < 0.0001).

