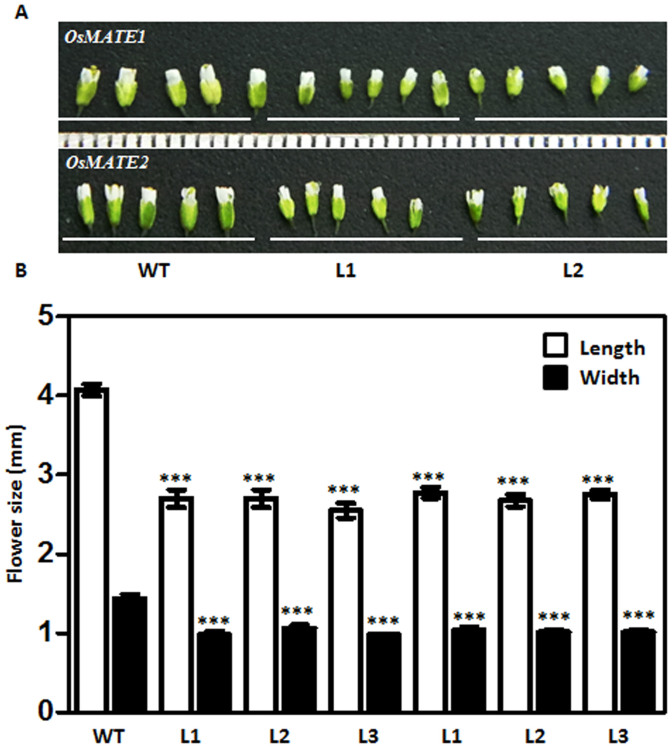
Figure 3. Variation of flower size in transgenic lines.
(A) Flower size, both length and width, was reduced in transgenic plants. Photograph of flowers were taken after 5 week growth under standard conditions. (B) Bars are mean of length and width of 3 independent lines of each gene and variation represent as ±SE (n = 8–12). Significance was evaluated by One-way ANOVA (Newman-Keuls used as post hoc test). ***Significantly different from WT (P < 0.0001).

