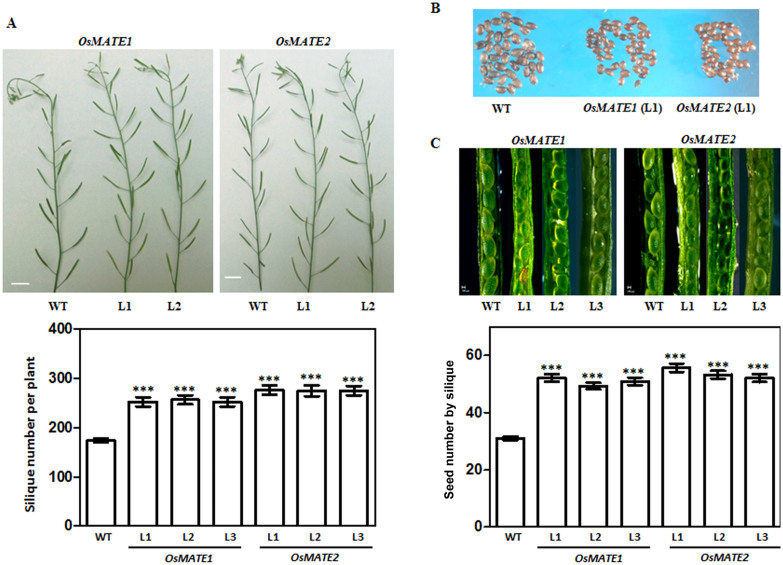
Figure 4. Alteration in silique and seed number in transgenic plants.
(A) All the transgenic lines more silique per plant than WT. Photograph of 6 week grown plants (2 lines of each transgenic) was taken. Data of 3 transgenic lines presented as mean and ±SE (n = 8–12). (B) Seed size of transgenic and WT plants (representative of 1 line of each transgenic). (C) Seeds number per silique was high in transgenic lines. Values were collected from 10 silique per plant and 8–12 plant for each lines and WT. Data are presented as mean, ±SE (n = 8–12). Significance was determined by One-way ANOVA (Newman-Keuls used as post hoc test). ***Significantly different from WT (P < 0.0001).

