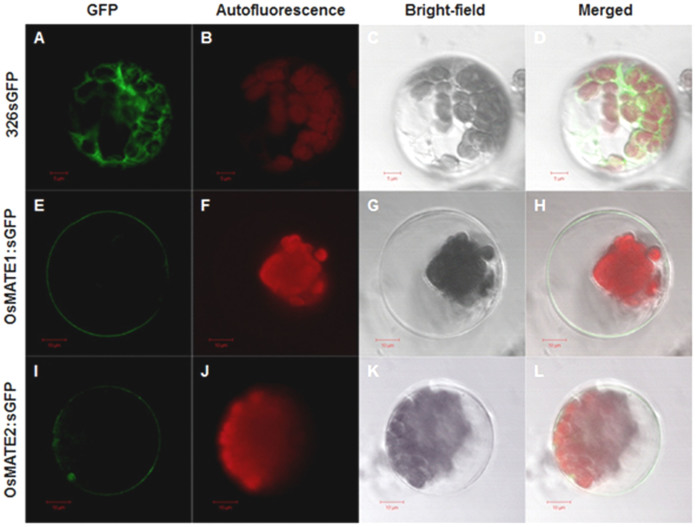
Figure 8. OsMATE1 and OsMATE2 reside on plasma-membrane.
Arabidopsis mesophyll protoplast transformed with 326sGFP (A–D), OsMATE1:GFP (E–H) and OsMATE2:GFP (I–L). Confocal cross sections show GFP fluorescence (excitation 488 nm and emission light measured through 505–530 nm band pass filter), autofluorescence of cell (excitation 543 nm, emission measured between 580 nm and 705 nm), bright field images and their overlay in different panels. (D) (H) and (I) represent overlay of (A–C), (E–G) and (I–K), respectively. Scale bars are included in images.

