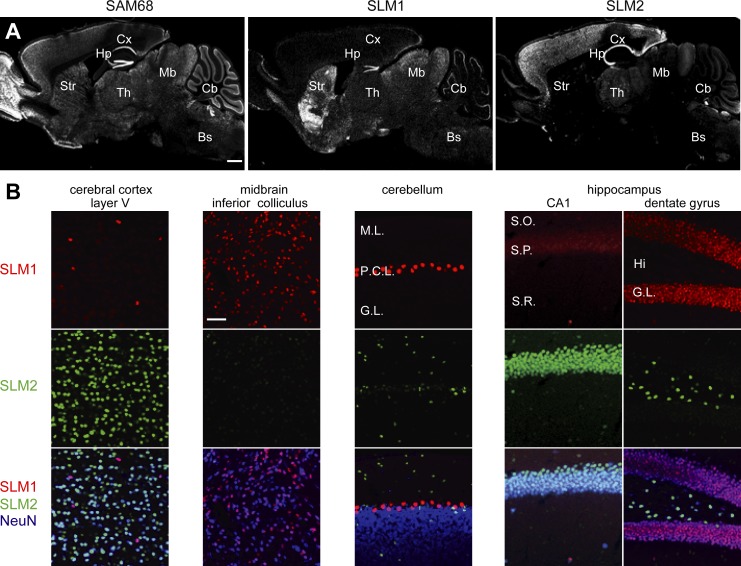
Figure 1.
Differential distribution of SLM1 and SLM2 proteins in the mouse brain. (A) Gross expression patterns of STAR family proteins in adult brain. Cx, cortex; Hp, hippocampus; Str, striatum; Th, thalamus; Mb, midbrain; Cb, cerebellum; Bs, brain stem. Bar, 1 mm. (B) High magnification images of SLM expression in various brain areas. I–III, cortical layer I–III; M.L., molecular layer; P.C.L., Purkinje cell layer; G.L., granular layer. S.O., stratum oriens; S.P., stratum pyramidale; S.R., stratum radiatum. Hi, hilus. Bar, 50 µm.

