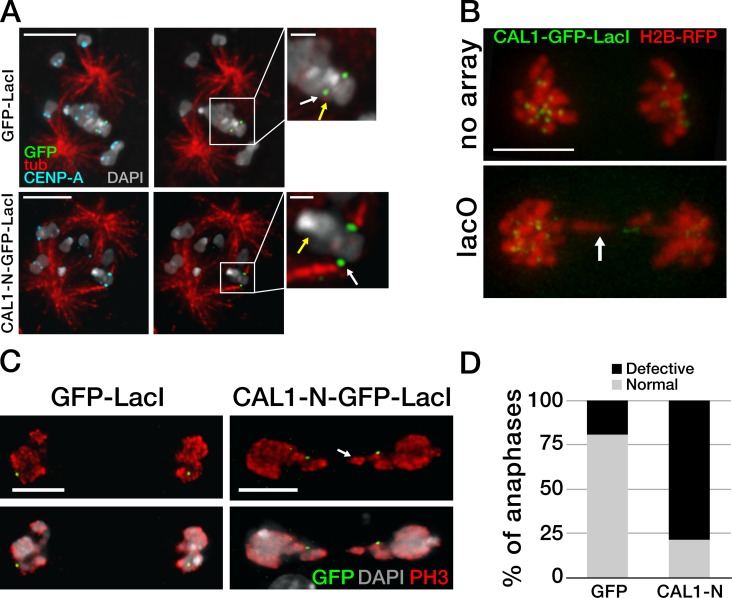
Figure 4.
Ectopic microtubule attachments are present at CAL1-induced ectopic centromeres. (A) Single-plane images showing GFP-LacI (top) and CAL1-N–GFP–LacI (bottom) bound to lacO and the presence or absence of kinetochore–microtubule attachments. The yellow arrow indicates the position of the endogenous centromere (plane not depicted). Attachments at the lacO were visible only in CAL1-N–GFP–LacI cells and not in GFP-LacI cells (green; white arrow). Insets are 3× magnifications of the area defined by the box. Bars: (main panels) 5 µm; (insets) 1 µm. (B) Still frames from time-lapse videos (see Videos 1 and 2) of representative mitotic cells expressing CAL1–GFP–LacI and H2B-mRFP in lacO S2 cells (lacO) and in control cells without lacO array (no array). Bar, 5 µm. (C) Anaphase lacO containing cells showing normal segregation with GFP-LacI and defective segregation with CAL1-N–GFP–LacI (both shown in green). Phospho-H3 Ser10 (PH3) is in red and DAPI in gray. Bars, 5 µm. The arrows show a stretched chromosome in B and C. (D) Quantification of the anaphase defects in C (nGFP-LacI = 104; nCAL1-N-GFP-LacI = 112; P = 0.0001). The experiment was repeated three times with similar results.

