Figure 1.
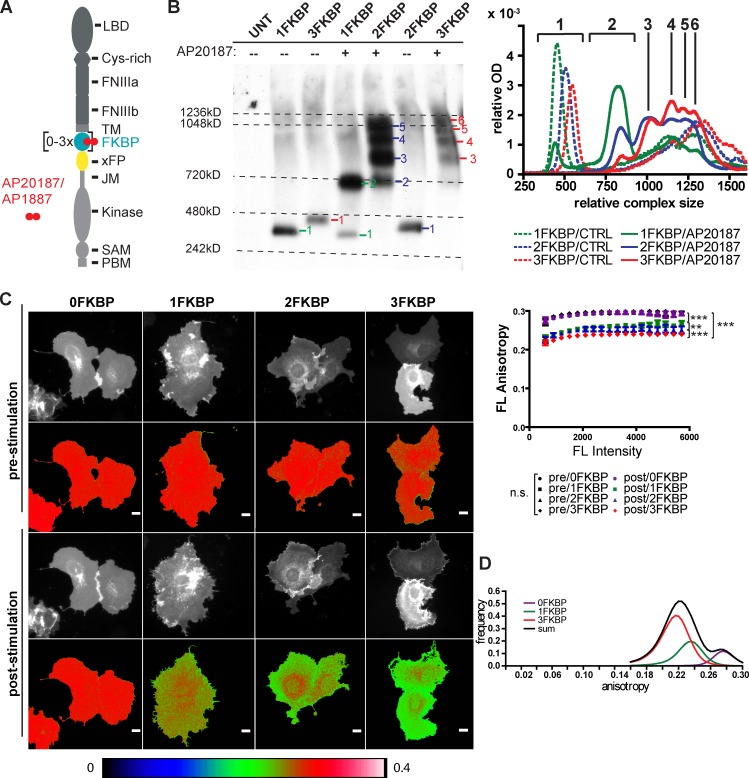
Generation and imaging of EphB2 cluster populations. (A) Domain structure of EphB2/A4 with 1 to 3FKBP domains and a single fluorescent protein (xFP indicates different variants of GFP) inserted in the cytoplasmic tail close to the transmembrane domain. Homodimerizers AP20187 (IC50 = 1.8 nM) or AP1887 (IC50 = 40 nM) noncovalently cross-link FKBP domains of neighboring Eph receptors. FNIII, fibronectin type III domain; JM, juxtamembrane; LBD, ligand-binding domain; TM, transmembrane; xFP, spectral variant of GFP. (B) AP20187-induced cluster sizes of kinase-dead EphB2-FKBP-mGFP isoforms visualized by blue native PAGE (UNT, untransfected). KdEphB2 was used to avoid rapid internalization. Note that EphB2 migrates as a much larger protein compared with denaturing conditions and small shifts in molecular mass are in accordance with the number of FKBP domains inserted (see Fig. S1 A). (right) An incremental mean optical density lane scan gives the distribution patterns with peaks indicating single resolvable cluster species. Incremented mean optical density was normalized to the sum over all increments. Representative experiment of n = 4. (C) Steady-state fluorescence anisotropy of dimerizer-induced EphB2 clusters in living cells. COS-7 cells transiently expressing kdEphB2 with different numbers of FKBP domains fused to mGFP were stimulated with 250 nM AP20187. Anisotropy values of representative cells before and 20 min after stimulation with AP20187 are shown. Bars, 20 µm. The color coding of images is shown on the bottom. The graph on the right shows anisotropy plots before and after stimulation of 0 to 3FKBP isoforms. Data represent mean anisotropy ± SEM of n = 57, 28, 22, and 20 cells from n = 3 independent experiments for 3FKBP, 2FKBP, 1FKBP, and 0FKBP integrated over whole frame, respectively. Post-stimulation curves of 0–3FKBP are all significantly different from each other and controls. (0/1FKBP, 0/2FKBP, 0/3FKBP, 1/3FKBP, and 2/3FKBP: ***, P < 0.001; 1/2FKBP: **, P < 0.01; Mann-Whitney nonparametric test). (D) The graph shows the intensity-weighted distribution of anisotropy values for the different association states. Data were extracted in ImageJ from raw eroded after dimerization anisotropy images (erosion = 10–15 pixels) for 0FKBP (n = 20 cells), 1FKBP (n = 22 cells), and 3FKBP (n = 57 cells) from n = 3 independent experiments. 0FKBP was used to represent the monomeric state (purple trace), 1FKBP the dimeric state (green trace), and 3FKBP the multimeric state (red trace). Summed anisotropy distributions (black trace) were later used for calculation of each association state contribution to a given anisotropy value.

