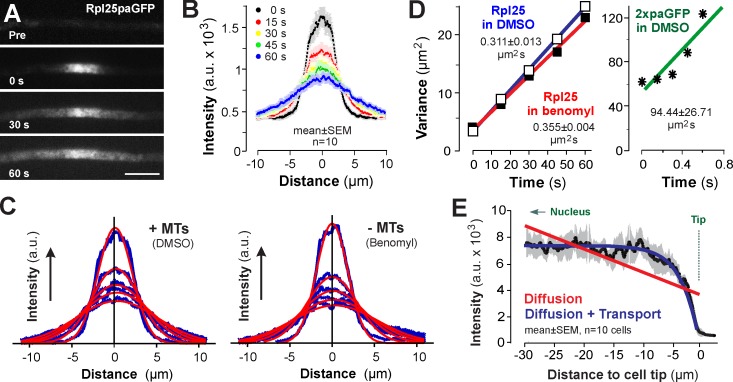
Figure 2.
Diffusion of photoactivatable Rpl25-paGFP. (A) Image series showing diffusion of Rpl25-paGFP. The protein becomes visible after activation with a 405-nm laser pulse and spreads rapidly. Time in seconds is indicated. Bar, 5 µm. (B) Diffusion behavior of Rpl25-paGFP. After photoactivation at T = 0 s, the signal spreads with time. Each data point represents the mean ± SEM; n = 10 cells from a single representative experiment. (C) Gaussian fittings (red) to intensity curves (blue) of spreading Rpl25-paGFP signals in cells treated with the MT-disrupting drug benomyl (−MTs) or the solvent DMSO (+MTs). Note that all curves are normally distributed (Shapiro-Wilk test for all curves; P < 0.0001); their R2 values are 0.61–0.86. Intensity profiles are given as the mean of 10 cells. (D) Variances of the fitted Gaussian distributions of Rpl25-paGFP spreading with time. Rpl25 in DMSO: Diffusion of Rpl25-paGFP in the presence of DMSO. Rpl25 in benomyl: Diffusion of Rpl25-paGFP in benomyl-treated cells. 2×paGFP in DMSO: Diffusion of a double-paGFPs in DMSO. Diffusion coefficients are given. Note that the cytoplasmic 2×paGFP diffuses much more rapidly than the slightly smaller Rpl25-paGFP. (E) Intensity profiles predicted by a mathematical model. The red line assumes that only diffusion distributes Rpl25-GFP, whereas the total amount of Rpl25-GFP remains the same. The blue line assumes diffusion and active transport. The latter fits well to the experimentally obtained Rpl25-GFP distribution data (black; data taken from Fig. 1 D).

