Figure 4.
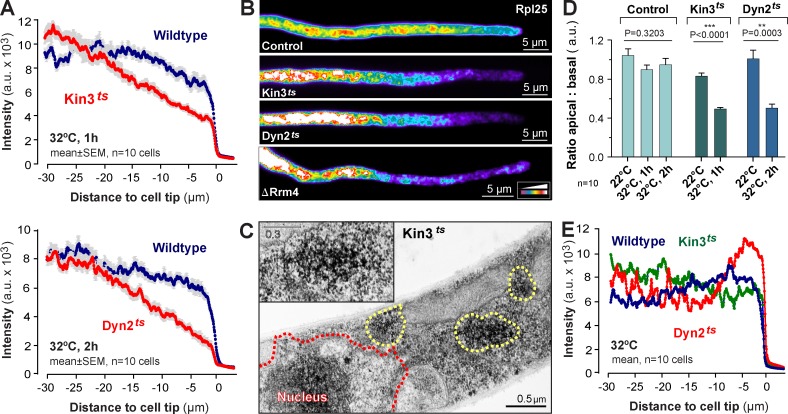
The role of kinesin-3, dynein, and Rrm4 in distributing ribosomes. (A) Fluorescence intensity profiles of Rpl25-GFP of hyphal wild-type cells (Wildtype) and temperature-sensitive kinesin-3 (Kin3ts) and dynein (Dyn2ts) mutants at 1 h or 2 h at 32°C. Each data point represents the mean ± SEM; n = 10 cells from a single representative experiment. (B) False-colored image of Rpl25-GFP in a control cell and temperature-sensitive kinesin-3 (Kin3ts) and dynein (Dyn2ts) mutants at 32°C, and a Δrrm4 mutant (ΔRrm4). Note that similar ribosome distribution defects are seen in all mutants. Images were 2D-deconvolved and brightness, contrast, and gamma settings were adjusted. The intensity color code is given in the bottom right. (C) Electron micrograph showing ribosomes in kinesin-3ts mutants after 1 h at 32°C. Ribosome clusters (yellow dotted line and inset) appear near the centrally located nucleus (red dotted line, Nucleus). (D) The ratio of Rpl25-GFP fluorescence at the tip (5–10 µm) to the basal region (25–30 µm). ** and ***, statistically significant difference at P = 0.0003 and P < 0.0001, respectively (Student’s t test). No difference was found in control cells at different temperatures (one-way ANOVA test, p-values are indicated). Bars are mean ± SEM (error bars); n = 10 cells from a single representative experiment. (E) Fluorescence intensity profiles of the ER marker GFP-HDEL in wild-type (Wildtype) and temperature-sensitive kinesin-3 (Kin3ts) and dynein (Dyn2ts) mutant cells at 32°C. Note that ER distribution is slightly altered in both mutants, which suggests that the motors participate in ER organization. However, no global reorganization of the network is seen (see also Fig. S2 D). Each data point represents the mean; n = 10 cells from a single representative experiment.

