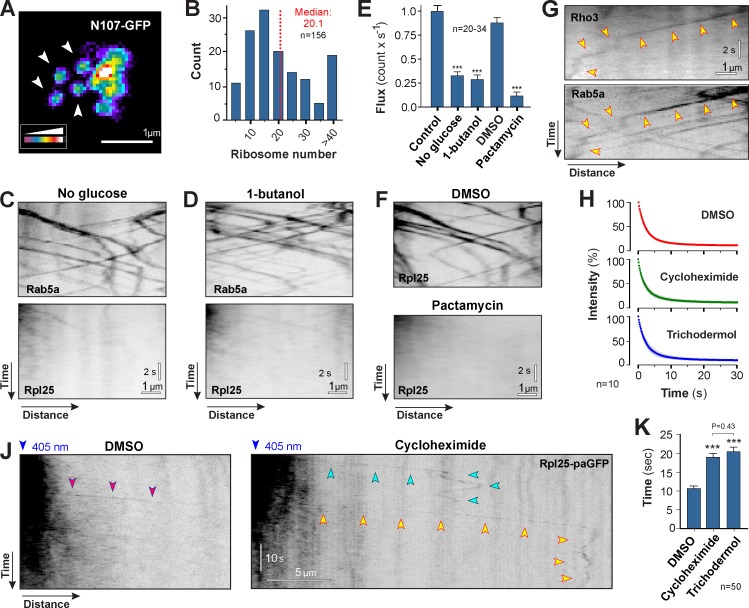
Figure 7.
Association of translationally active polysomes to early endosomes. (A) False-color image of fluorescent nuclear pores in U. maydis. The endogenous copy of Nup107 was fused to GFP (Nup107-GFP). Each nuclear pore contains 16 Nup107-GFP and shows homogenous signal intensity (arrowheads). Images were 2D-deconvolved and false-colored, and brightness, contrast, and gamma settings were adjusted. (B) Number of ribosomes within motile Rpl25-GFP signals. Numbers were estimated using Nup107-GFP as an internal calibration standard. Data are non-normally distributed (Shapiro-Wilk test, P < 0.0001), and median and sample size from a single representative experiment are indicated. (C) Motility of ribosomes (Rpl25-GFP) under glucose depletion stress (no glucose for 10 min), which largely abolished polysome formation on motile EEs (Rab5a). Images are contrast inverted and brightness, contrast, and gamma settings were adjusted. See Video 7. (D) Motility of ribosomes (Rpl25-GFP) under 1-butanol–induced stress (1% [vol/vol] 1-butanol for 10 min). This treatment largely abolished polysome formation on motile EEs (Rab5a). Images are contrast inverted, and brightness, contrast, and gamma settings were adjusted. See Video 7. (E) Frequency of ribosome motility under glucose depletion (No glucose), 1-butanol–induced stress (1-butanol), and block of translation initiation (pactamycin). All bars are given as mean ± SEM (error bars); the sample size for each single representative experiment was between 20 and 34 cells. ***, statistical significance at P < 0.0001 using a Student’s t test. (F) Motility of ribosomes (Rpl25-GFP) in the presence of the solvent DMSO and the translation initiation inhibitor pactamycin. Note that verrucarin A treatment showed the same effect (see Fig. S5, E and F). Images are contrast-inverted and adjusted with brightness, contrast, and gamma settings. See Video 7. (G) Colocalization of nascent GFP3-Rho3 and mCherry-Rab5a–labeled EEs. Note that rho3 mRNA is transported to the septum, where the majority of the Rho3 protein is localized to function (König et al., 2009). Images are contrast inverted and brightness, contrast, and gamma settings were adjusted. Arrowheads indicate one trajectory. (H) Bleaching curves of Rpl25-paGFP in the presence of the solvent DMSO and the translation elongation inhibitors cycloheximide and trichodermol. Each data point represents the mean ± SD (error bars) average signal intensity; n = 10 cells from a single representative experiment. (J) Photoactivated Rpl25-paGFP in DMSO (purple arrowheads) and the inhibitor cycloheximide (green and yellow arrowheads). Note that signals disappear faster in DMSO. Images are contrast inverted and brightness, contrast, and gamma settings were adjusted. (K) Residence time of Rpl25-paGFP on EEs. Bars are given as mean ± SEM (error bars); n = 50 cells from 2–6 experiments. ***, statistical significance at P < 0.0001. The p-value for a nonsignificant pair is given (Mann-Whitney test).

