Figure 1.
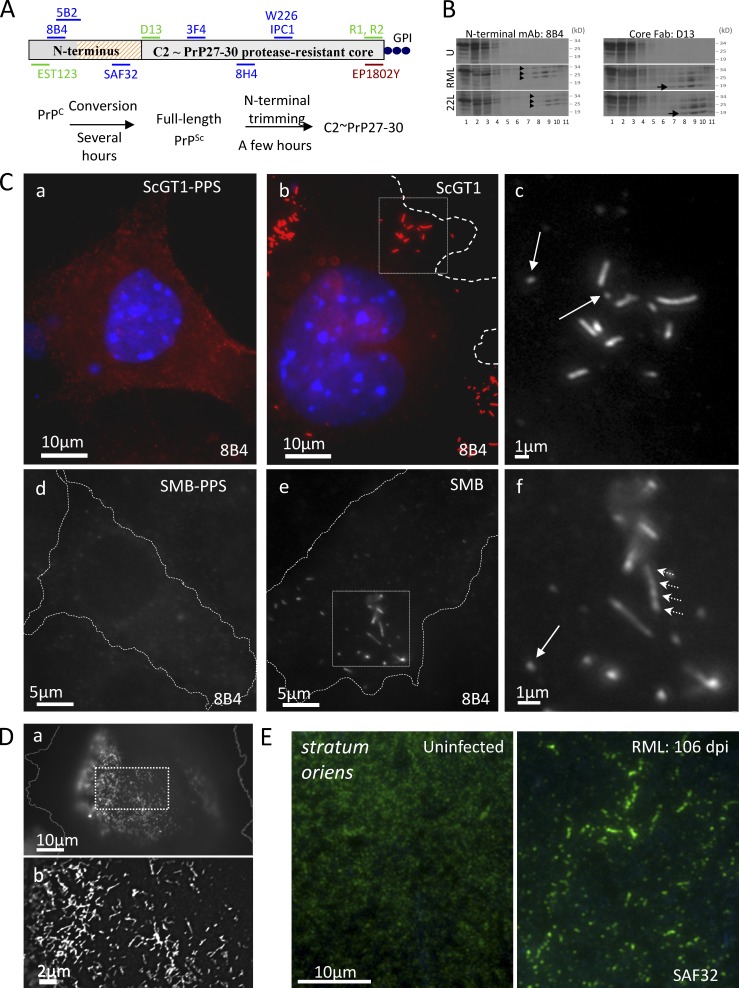
N-proximal PrP Abs decorate clusters of micrometer-long strings and webs in infected cells and hippocampus. (A) Abs and Fabs used in this study; summary of PrPSc metabolism. Hatched, octarepeats (aa 51–90); blue, mouse mAbs; green, humanized Fabs. EP1802Y is a rabbit mAb. (B) Lysates of uninfected GT1 (U) and of infected ScGT1/RML and ScGT1/22L cells were fractionated by sedimentation through sucrose-Sarkosyl gradients (top, fraction 1). Fractions were analyzed in WB developed with N-terminal mAb 8B4 or core Fab D13. Arrowheads show the glycoforms of highly aggregated FL PrPSc (fractions 8–11). Arrow (right) shows the 19-kD unglycosylated version of PrP27-30, which is not recognized by 8B4 (left; see also Fig. S2 C). PrP27-30 and FL PrPSc aggregates are absent from GT1 lysate. See also Fig. S1 H. (C) Subconfluent infected or PPS-cured ScGT1 (a–c) and SMB (d–f) cells were fixed, permeabilized, stained with 8B4 (red; a and b), counterstained with DAPI (blue; a and b), and examined by fluorescence microscopy with a 100× objective. Cells were outlined using the corresponding DIC pictures (Fig. S2 E). Boxes in b and e are enlarged in c and f, respectively. In infected cells, 8B4 decorates clusters of strings up to 5 µm long; arrows show short strings. The seemingly intense PrPC signal observed in ScGT1-PPS compared with that in ScGT1 is discussed in the Immunofluorescence section of Materials and methods. (D) ScGT1 growth-arrested by a 6-d MMC/BrdU treatment were stained with mAb SAF32 using the FA-denaturing protocol. Webs of strings cover large parts of the cell periphery. (b) Enlarged, 3D deconvolved version of box in a. (E) SAF32 labeling of cryosections of uninfected and RML infected hippocampus stratum oriens of FVB mice at 106 dpi.

