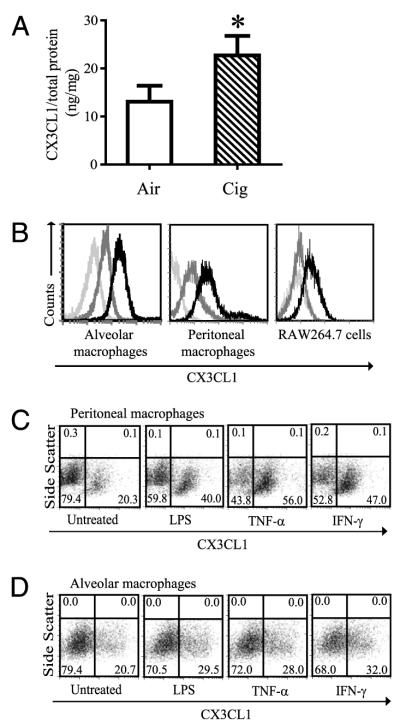
FIGURE 1.

Transmembrane CX3CL1 expression on macrophages. A, Lung homogenates were obtained from C57BL/6 mice after air or cigarette smoke exposure for 8 wk and assayed for CX3CL1 expression. CX3CL1 concentration was normalized to the amount of total protein measured in each sample and is expressed as ng/mg ± SD. n = 8 mice per group. *p < 0.05. B, Mouse alveolar macrophages (left panel), peritoneal macrophages (middle panel), and mouse macrophage cell line RAW 264.7 cells (right panel) constitutively express transmembrane CX3CL1. Light-gray histogram, absence of immunostaining. Dark-gray histogram, isotype control staining. Black histogram, CX3CL1 staining. Representative images from four independent experiments are shown. C and D, Transmembrane CX3CL1 expression on peritoneal macrophages (C) and alveolar macrophages (D) is induced by TNF-α (20 ng/ml), IFN-γ (500 U/ml), and LPS (100 ng/ml) after 6 h stimulation (pooled cells from n = 9 to 12 mice).
