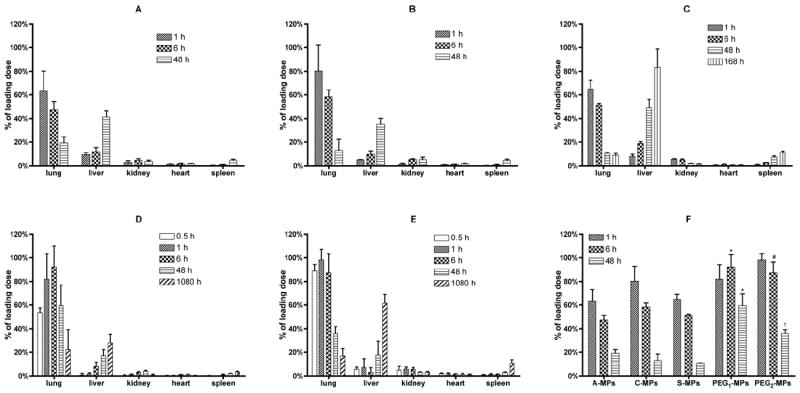
Fig. 3.

The biodistribution of 6 μm MPs with different surface properties at various time points. Biodistribution of MPs (A): A-MPs; (B) C-MPs; (C): S-MPs; (D): PEG1-MPs; and (E): PEG2-MPs (n = 3, mean ± S.D.). The biodistribution of the unmodified MPs is similar and the resulting lung AUCs (Table 2) are statistically different than the lung AUCs of the PEGylated MPs by one-way ANOVA. (F) Compilation of lung MP retention from (A)-(E); * = P < 0.05 compared to A-, C- or S-MPs; # = P < 0.05 compared to A- or S-MPs; † = P < 0.05 compared to S-MPs by one-way ANOVA. Figure 3C is reprinted with permission from Kutscher et al. (Kutscher et al., 2010).
