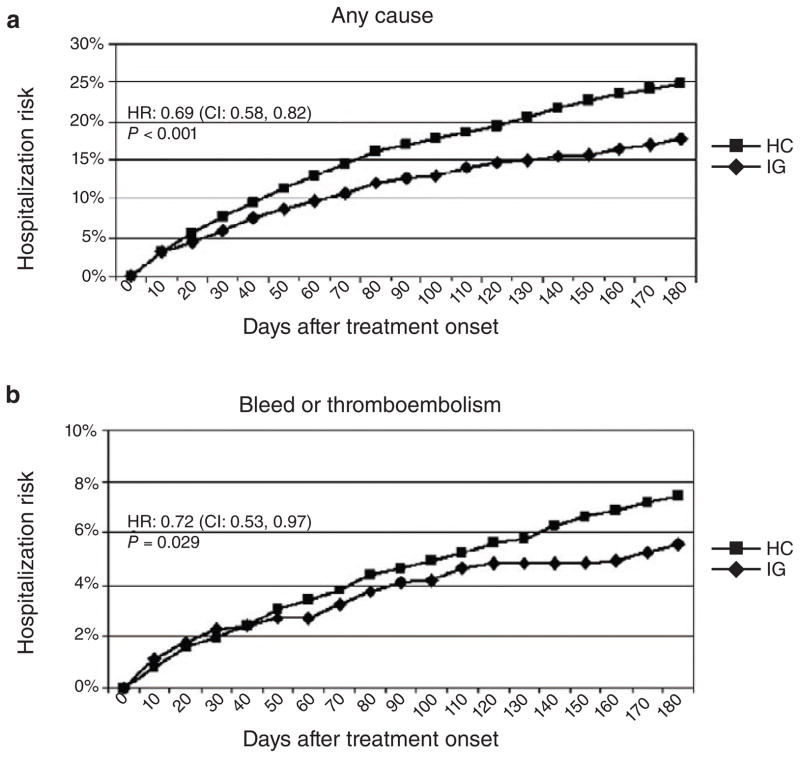
Figure 1.
Adjusted hospitalization rates: intention-to-treat analysis. The figure shows the hospitalization rate for patients in each study group during the 6-month period following initiation of warfarin treatment. (a) Events due to any cause; (b) events due to bleeding or thromboembolism. CI, confidence interval; HC, historical control; HR, hazard ratio; IG, intervention group. Reprinted with permission from ref. 6.

