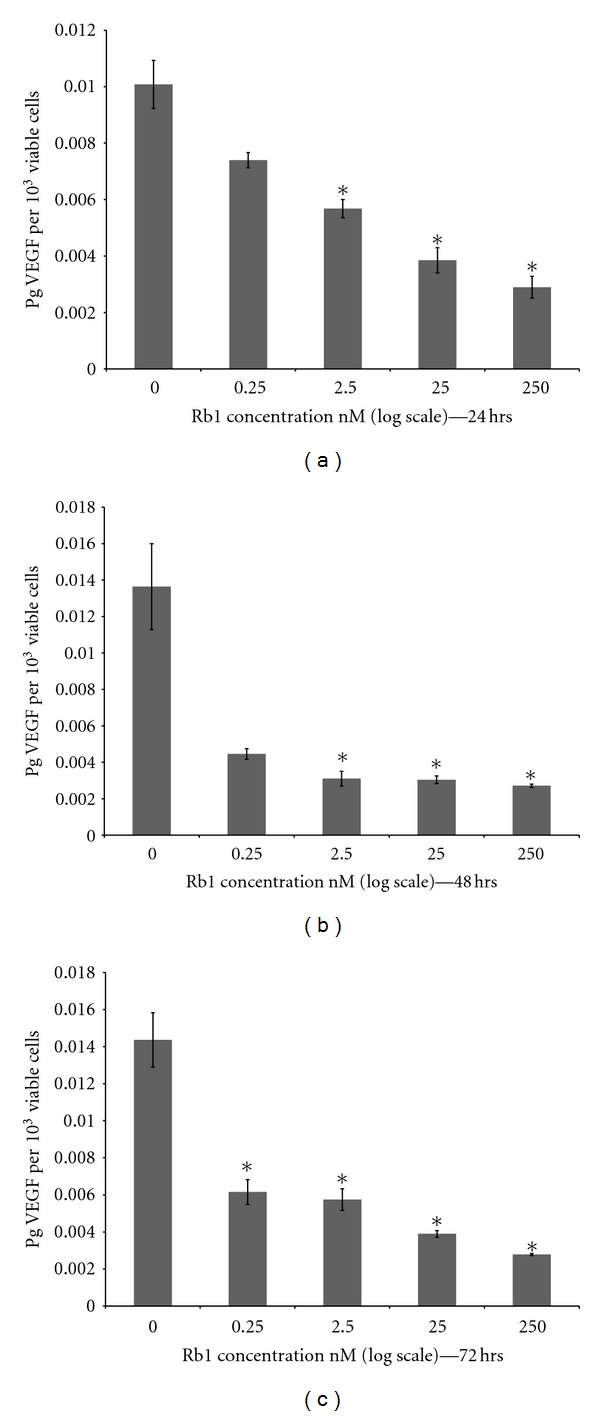
Figure 2.

Effect of different concentrations of Rb1 on VEGF release with increasing time. Cells were seeded at 20,000 per well on day 0. The cells were treated with 0, 0.25, 2.5, 25, and 250 nM concentrations of Rb1 for 24, 48, and 72 hrs. Conditioned media was collected and ELISA performed for the total protein concentration for each day. The results shown in the graph indicate the mean pg of VEGF per 10,000 viable cells for the respective day ± SE. (a), (b), and (c) are the mean pg of VEGF per 10,000 viable cells when treated with different concentrations of Rb1 during the 0 hr to 72 hr treatment periods ± SE. Asterisks indicate statistical significance of P ≤ 0.05 (n = 3).
