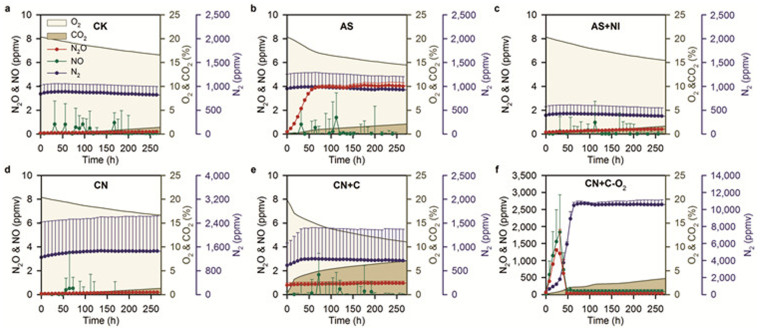
Figure 3. Kinetics of gaseous N2O, NO, N2, O2, and CO2 in robotized analytical/incubation systems.
(a), Control treatment (CK). (b), Ammonium sulfate (AS). (c), AS with nitrification inhibitor (AS + NI) 3,4-dimethylpyrazole phosphate (DMPP). (d), Calcium nitrate (CN). (e), CN with glucose (CN + C). (f), without oxygen from the system of treatment CN + C (CN + C-O2). Soils were incubated at 70% WFPS. Error bars in plots (a–f) are standard deviation of the mean (n = 4 replicates). Note that the right and left y axis scales have large differences. In some cases the error bars are smaller than the symbols.

