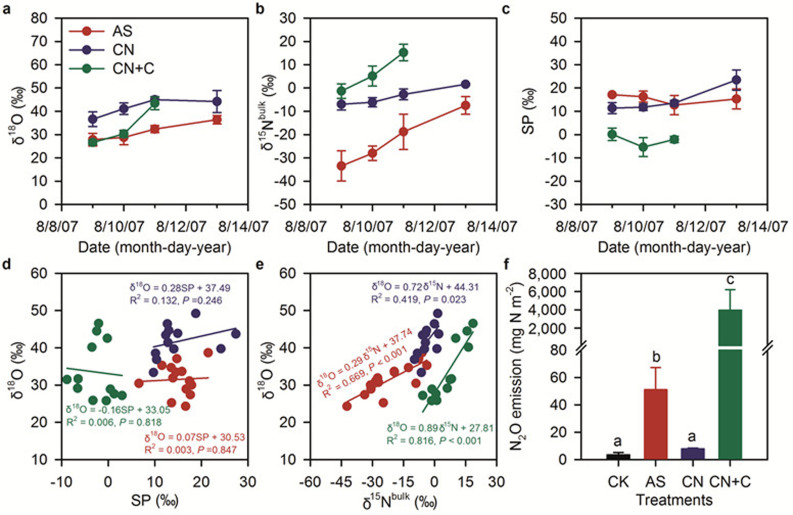
Figure 4. Isotopic fingerprints and emissions of N2O.
(a), δ18O. (b), δ15Nbulk. (c), δ15N site preference (SP). (d), δ18O (vs. SMOW) versus SP. (e), δ18O versus δ15Nbulk. (f), cumulative N2O emissions. AS, CN, CN + C, and CK denote amendment with ammonium sulfate, calcium nitrate, and calcium nitrate + glucose + compaction of soil, and control, respectively. Error bars in plots (a), (b), (c), and (f) are standard deviation of the mean (n = 4). Note that data points are individual observations of the treatments in plots (d) and (e).

