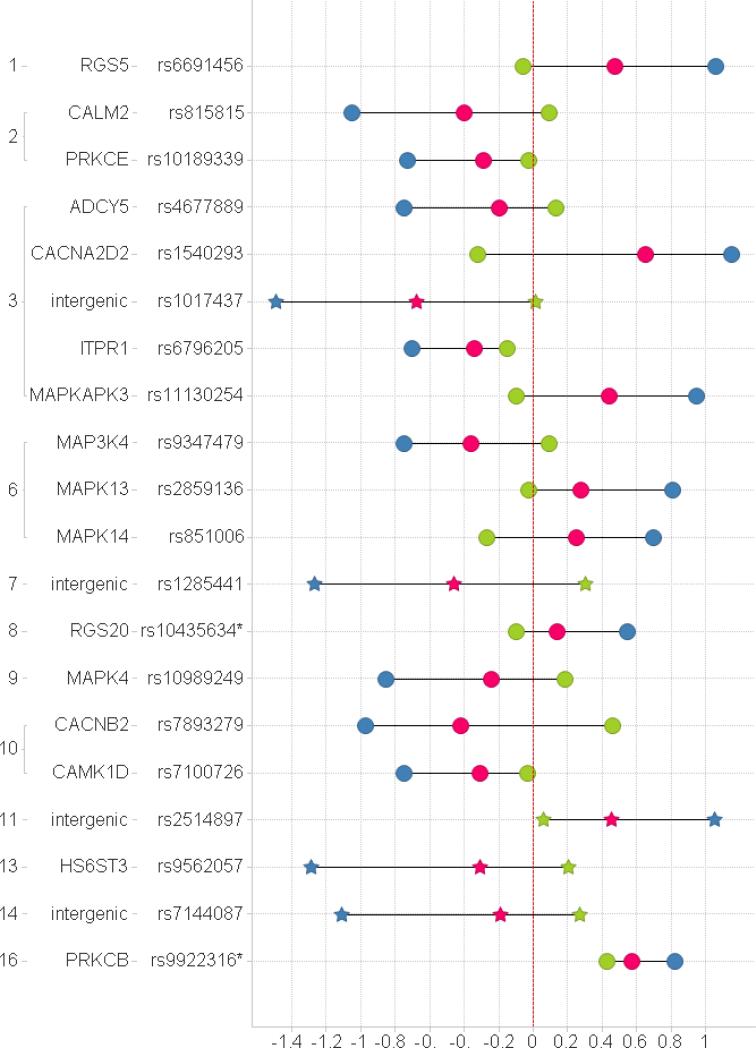
Fig. 2.
Beta coefficients (x axis). The coefficients describe the effect sizes of genes in the analysis. Green – replication (Vanderbilt); Blue – GWAS (discovery, Turku); Red - combined; Circle - candidate gene list; Star - GWAS list. The dotted vertical line denotes a beta coefficient of 0 (no effect). The locations of the investigated SNPs in the human genome are indicated with the human chromosome number (far left) and the name of the gene. * PRKCB and RGS20 were not directly assessable by the employed genotyping technology and the second-best SNPs were used in their place.

