
Figure 10.
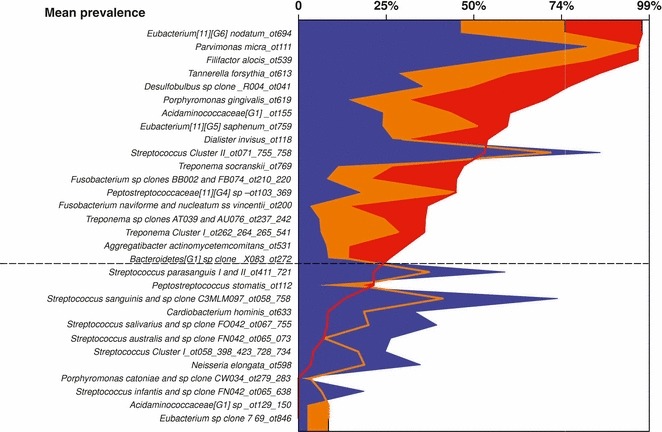
Bacterial taxa detected in sites with different pocket‐depth categories at baseline. Sites with a pocket depth of <4 mm are shown in blue, those with a pocket depth of 4–6 mm are shown in orange and those with a pocket depth of >6 mm are shown in red. Only taxa that presented a significantly different prevalence across site categories were plotted (Kruskal‐Wallis, P < 0.05).