
Figure 16.
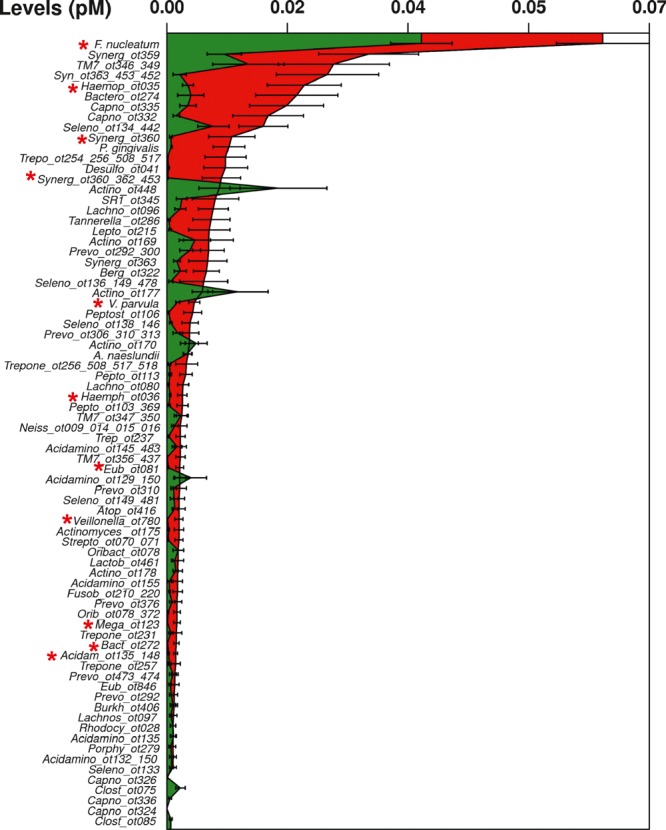
Levels of selected taxa in sites from periodontally healthy patients (green) (n = 8) and from patients with chronic periodontitis (red) (n = 8). Values are given as pM ± standard error of the mean. Significant differences are indicated with an asterisk (Mann–Whitney U‐test, P < 0.05).