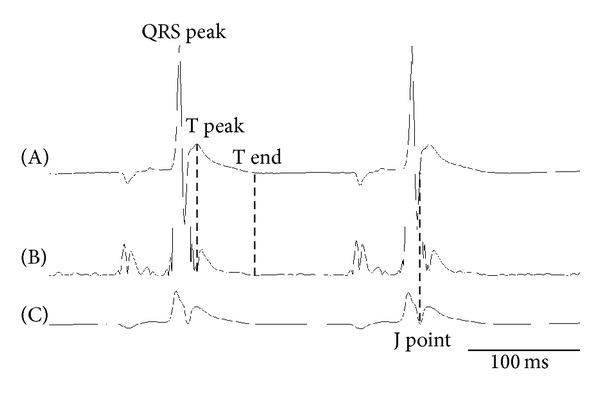
Figure 1.

ECG interval analysis. Upper trace (A) is an original ECG and (B) is a form of the absolute value processing and after the first differential. (C) is a form after the smoothing procedure. Representative trace of lead CM5. T peak: peak of T wave, T end: end of T wave, and J point: onset of J wave.
