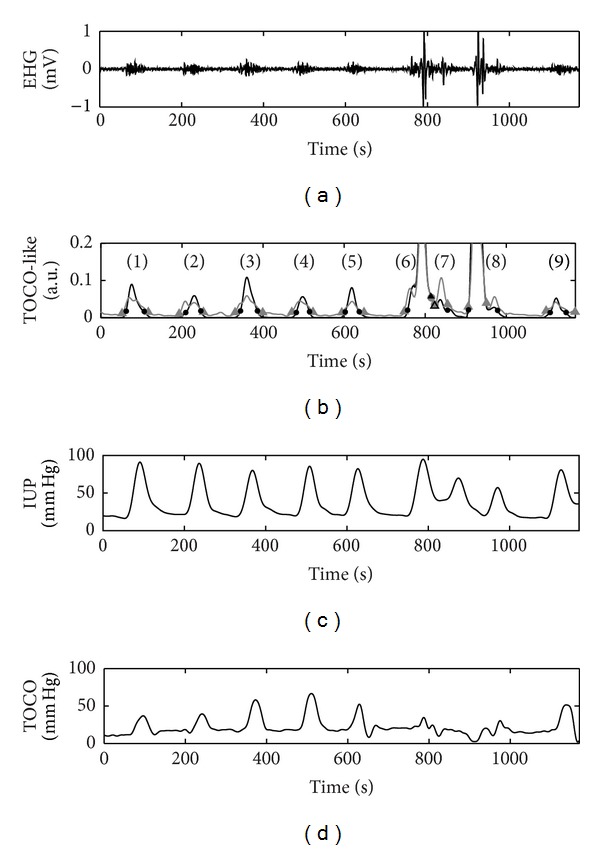
Figure 3.

(a) EHG signal. (b) TOCO-like signal generated from EHG signal using RMS-based algorithm (grey line) and the unnormalized first statistical moment of the frequency spectrum algorithm (black line). The signal windows with amplitude significantly different from the baseline identified by the automatic contraction detector are marked by grey triangle and black point, respectively. (c)-(d) IUP and TOCO were acquired simultaneously.
