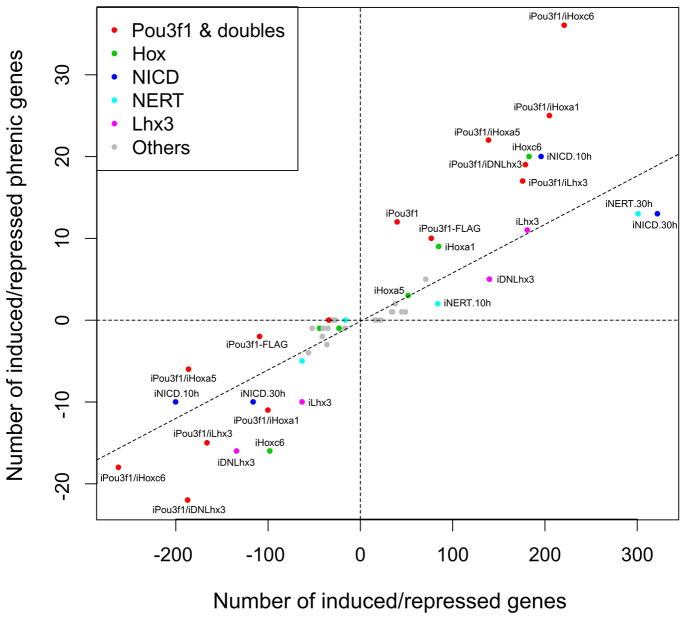
Fig. 4.
Identification of TFs that control parts of the PN-specific transcriptional pattern. MACS-sorted ESC-MNs were induced to express candidate determinants, and their transcriptional profiles were examined by Affymetrix array analysis. In the scatter plot, the number of PN-specific genes induced/repressed (y-axis) is plotted against the number of all genes induced/repressed (x-axis) by a given candidate factor or combination thereof. The diagonal line represents a robust fit through all the points shown, both induced and repressed.

