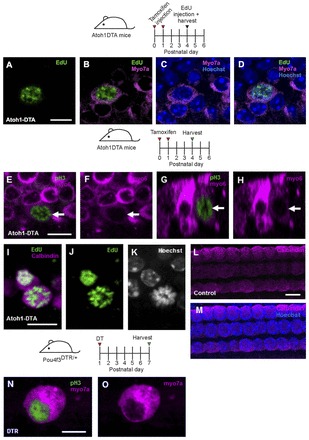
Fig. 8.

Myo7a+ cells are active in the cell cycle. (A-D) Confocal image of EdU incorporation (green) in Myo7a+ cells (magenta) in the Atoh1DTA model 4 hours after EdU injection at P4. (E-H) A pH3+ (green) HC (Myo6, magenta) was observed at P4 in the Atoh1DTA model. (G-H) Cross-section focused on the pH3+ HC indicated by the arrow in E. Note that Myo6 expression of this cell is less robust than in adjacent cells. (I-K) An EdU+ (green) HC (calbindin, magenta) with mitotic figures (Hoechst, grayscale) was observed in the Atoh1DTA model 24 hours after EdU injection at P4. (L,M) Control tissue (lacking either the Cre or DTA allele) shows expression of calbindin (magenta) in HC nuclei in tissues that were processed for EdU staining. (N,O) A pH3+ (green) HC (Myo7a, magenta) was observed at P7 in the Pou4f3DTR/+ model. Scale bars: 10 μm.
