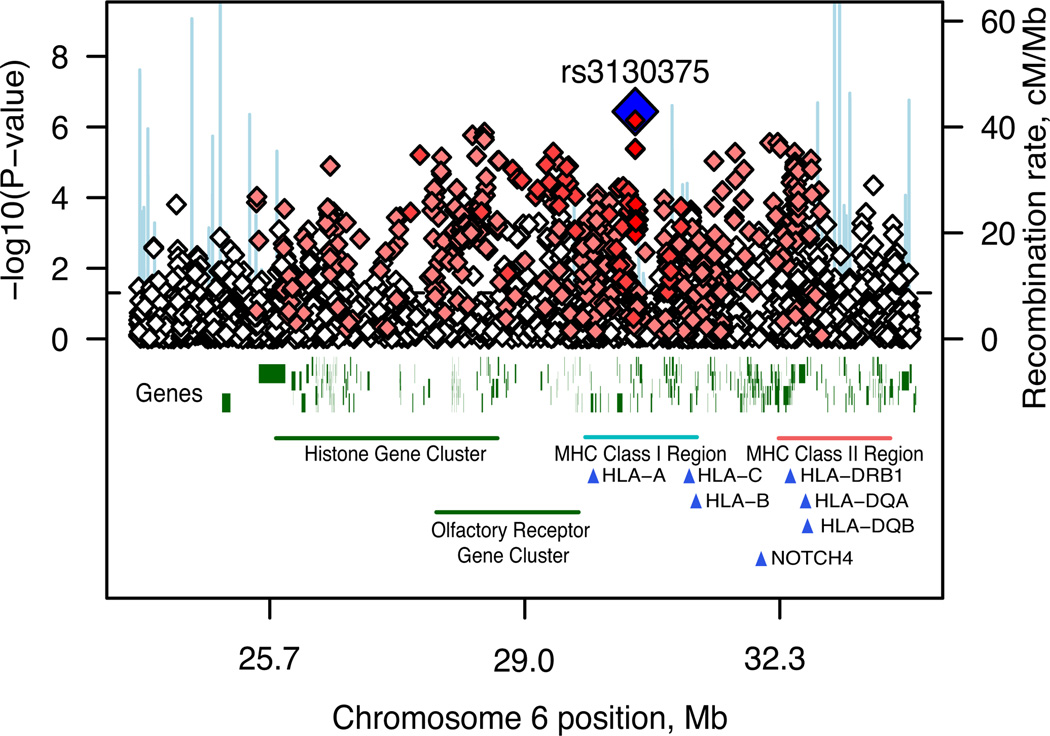
Figure 1. Association results across the MHC region.
Results are shown as –log10 (P-value) for genotyped SNPs. The most associated SNP is shown as a blue diamond. The colour of the remaining markers reflects r2 with rs3130375, light pink, r2 > 0.1, red, r2 > 0.8. The recombination rate from the CEU HapMap (second Y-axis) is plotted in light blue.

