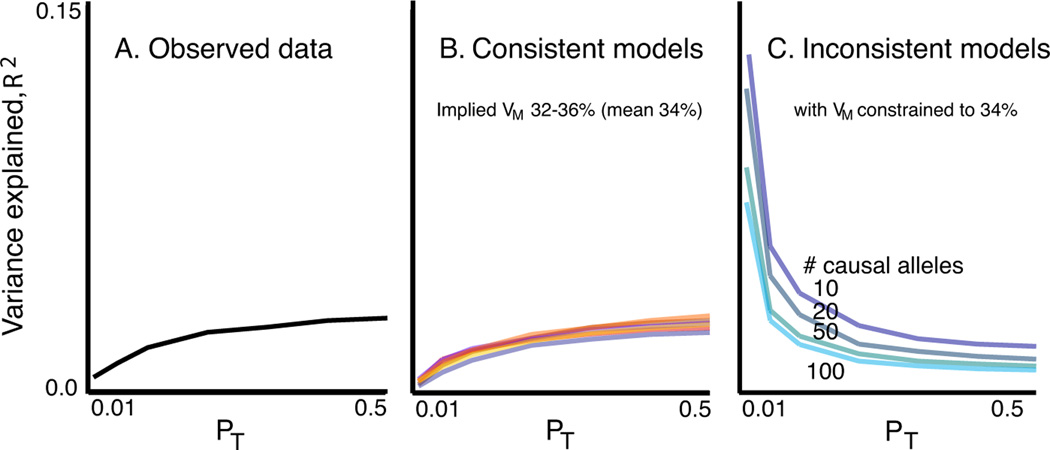
Figure 3. Observed and simulated profiles of target sample variance explained.
Panel A shows the observed variance explained (R2, black line). Panel B shows a subset of models that produced results consistent with the observed data. All yielded similar estimates of the total variance explained by the SNPs that tag the causal variants, VM, with a mean value of 34%. The seven models were: (% SNPs, Mean GRR/variance explained (V) per causal allele, LD, frequency model) M1: 6.25%, GRR=1.05, r2 =1, empirical; M2: 25%, GRR=1.025, r2 =1, empirical; M3: 12%, GRR=1.05, r2 <1, uniform; M4: 32%, GRR=1.04, r2 <1, U-shaped; M5: 11%, V=0.00006, r2 =1, empirical; M6: 25%, GRR(Exponential)=1.025, r2 <1, uniform; M7: 100%, GRR(Exponential)=1.012, r2 <1, uniform. Panel C shows four inconsistent models with fewer variants of larger effect.

