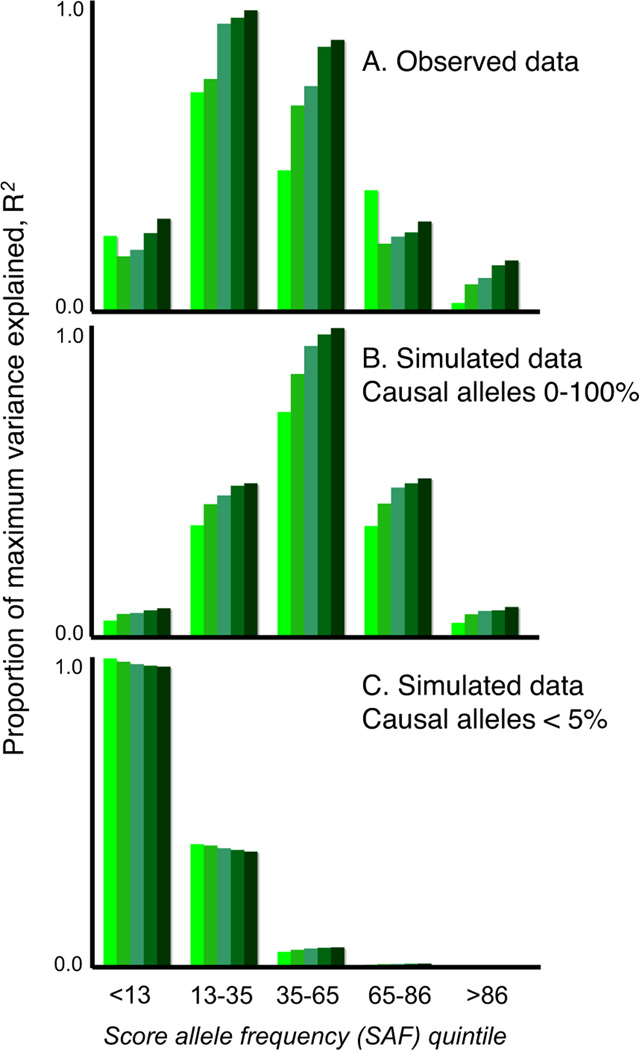
Figure 4. Analysis stratified by score allele frequency.
Panel A shows the observed data for the ISC/MGS-EA comparison. The y-axis is the target sample pseudo R2, scaled within each figure as a proportion of the maximum value observed. The two other plots show results for simulated data: the common variant model, with a uniform frequency distribution for causal risk-increasing alleles (panel B) and a multiple rare variant (MRV) model, in which the collective frequency of rare variants at a locus that all reside on the same haplotypic background with respect to the genotyped SNP was bounded at a maximum of 5% (panel C).

