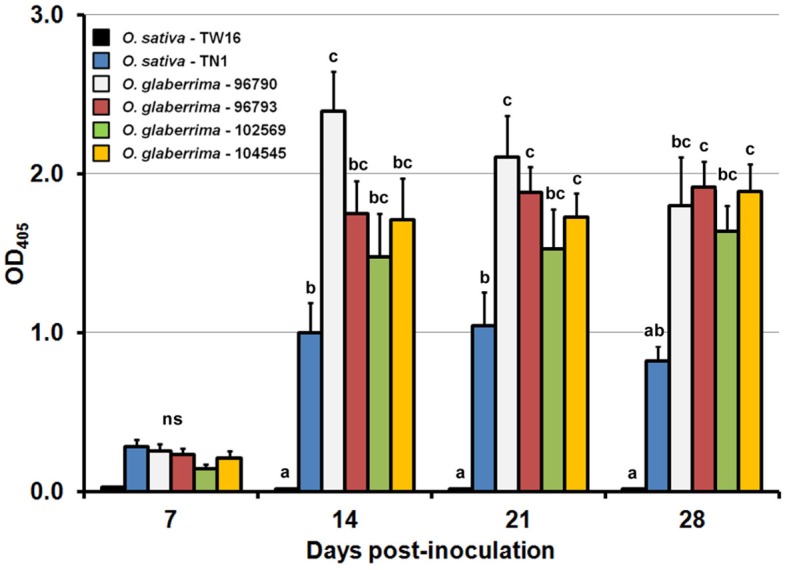
Figure 2.

Temporal changes in the accumulation of Rice tungro spherical virus in plants of Oryza glaberrima and O. sativa. Vertical bars and vertical lines indicate means and standard errors of mean, respectively, for the absorbance at 405 nm at the respective time points. Means and standard errors of mean were based on three independent experiments (n = 5 per treatment and time point in one experiment). Bars at the same days post-inoculation indicated by different letters are significantly different by the least significant difference test at the 95% confidence level. ns: not significantly different.
