
Fig. 2.
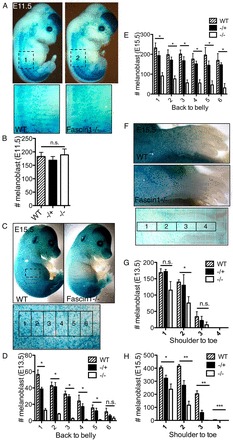
Loss of fascin 1 results in fewer melanoblasts by E13.5 and E15.5. (A) Wild-type and fascin 1-/- embryo pictures and cropped areas used for quantitation (E11.5). (B) Cell number in dorsal-ventral part of E11.5 embryos (wild type, n=8; -/+, n=6; -/-, n=3). Kruskal-Wallis one-way ANOVA test and Mann-Whitney test, n.s., not significant. (C) Wild-type and fascin 1-/- pictures of whole embryos (E15.5) with cropped, gridded subareas for quantitation. (D,E) Melanoblast number in dorsal-ventral regions of E13.5 (D) and E15.5 (E) embryos. (F) Wild-type and fascin 1-/- pictures of the forelimbs with cropped, gridded subareas for quantitation. (G,H) Melanoblast number in the forelimbs of E13.5 (G) and E15.5 (H) embryos. Results are expressed as means±s.e.m. (four to six embryos for each genotype), Kruskal-Wallis one-way ANOVA tests were used to compare melanoblast numbers between wild type, -/+ and -/- in each subarea and Mann-Whitney tests were used to compare between two groups, *P<0.05; **P<0.01; n.s., not significant.