
Fig. 4.
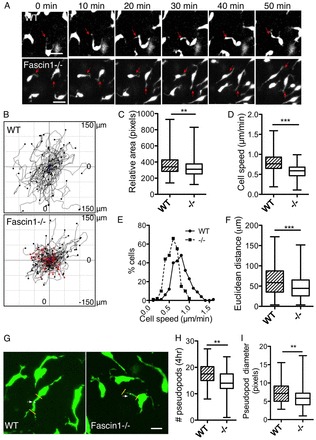
Fascin 1 loss reduces melanoblast cell migration speed and pseudopod generation (E14.5). (A) Picture series of melanoblast migration (wild type and fascin 1-/-). Red arrows indicate the protruding pseudopods. Scale bars: 10 μm. (B) Cell tracks of wild type and fascin 1-/- representative movies. Red lines represent cells with speed slower than 0.5 μm/minute. (C) Relative cell area expressed as pixels and measured with ImageJ line tool. Between 170 and 200 cells are analysed. (D,E) Cell speed (D) and frequency distribution of cell speed (E) of wild-type and fascin 1-/- melanoblasts, as measured with ImageJ plug-in chemotaxis tool. (F) Euclidean migration distance in wild-type and fascin 1-/- melanoblasts. Data are generated from three movies (three different embryos) and 230-250 cells from each genotype are analysed in total. (G) Detailed pictures with cell protrusions. White arrowheads indicate the midpoint of the pseudopods where the diameter was measured. (H,I) Protrusion numbers that melanoblasts generate in 4 hours (H) and pseudopod diameter (I) in still z stacked pictures. Pseudopods of 80-130 cells from three embryos were analysed. Scale bars: 10 μm. In the box and whisker plots, horizontal line indicates median, box indicates interquartile range and whiskers indicate maximum value to minimum value. Mann-Whitney test; **P<0.01; ***P<0.001.