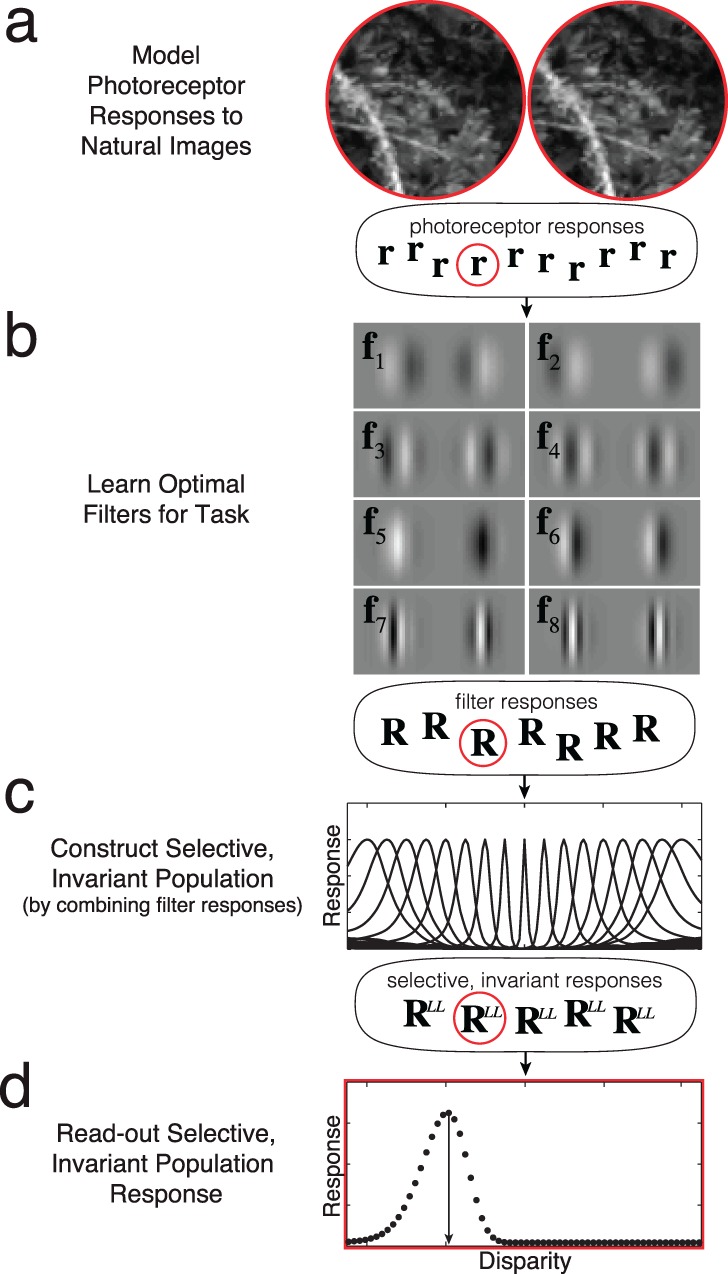
Figure 2.

Hierarchical processing steps in optimal disparity estimation. (a) The photoreceptor responses are computed for each of many natural images, for each of many different disparities. (b) The optimal filters for disparity estimation are learned from this collection of photoreceptor responses to natural stimuli. These are the eight most useful vertically oriented filters (receptive fields) (see also Figure 3a). Left and right eye filter weights are shown in gray. Filter responses are given by the dot product between the photoreceptor responses and filter weights. (c) The optimal selective, invariant units are constructed from the filter responses. Each unit in the population is tuned to a particular disparity. These units result from a unique combination of the optimal filter responses (see also Figure 7). (d) The optimal readout of the selective, invariant population response is determined. Each black dot shows the response of one of the disparity-tuned units in (c) to the particular image shown in (a). The peak of the population response is the optimal (MAP) estimate. Note that r, R, and RLL are vectors representing the photoreceptor, filter, and disparity-tuned-unit population responses to particular stimuli. Red outlines represent the responses to the particular stereo-image patch in (a). The steps in this procedure are general, and will be useful for developing ideal observers for other estimation tasks.
