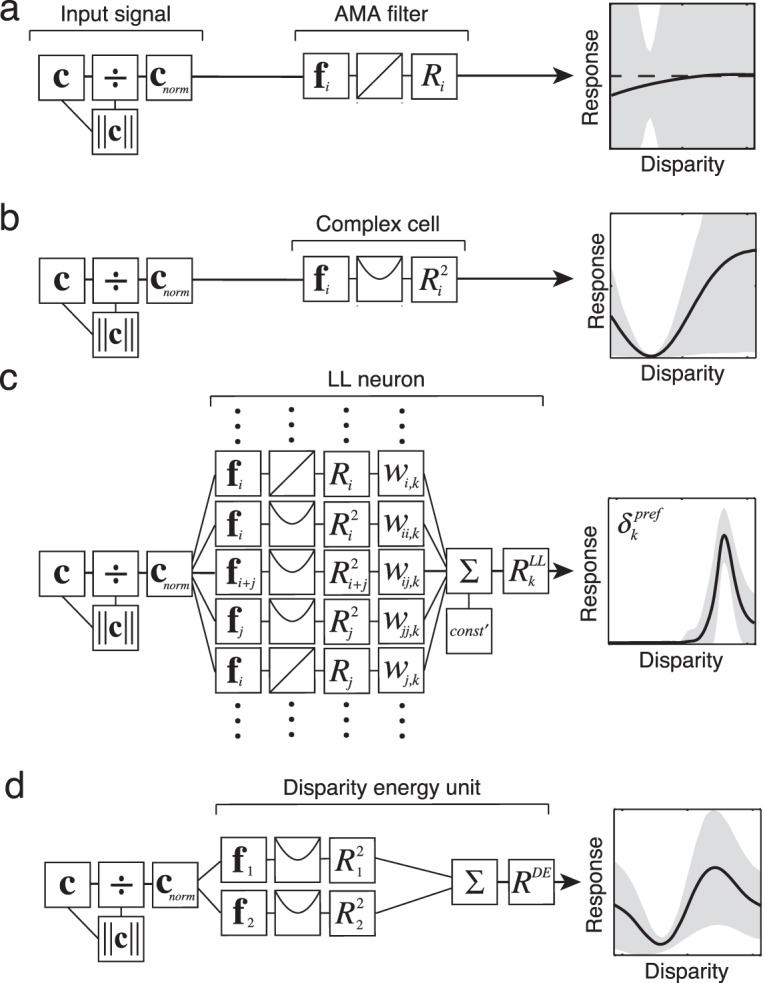
Figure 6.

Biologically plausible implementation of selective, invariant tuning: processing schematics and disparity tuning curves for an AMA filter, a model complex cell, and a model log-likelihood (LL) neuron. For comparison, a disparity energy unit is also presented. In all cases, the inputs are contrast normalized photoreceptor responses. Disparity tuning curves show the mean response of each filter type across many natural image patches having the same disparity, for many different disparities. Shaded areas show response variation due to variation in irrelevant features in the natural patches (not neural noise). Selectivity for disparity and invariance to irrelevant features (external variation) increase as processing proceeds. (a) The filter response is obtained by linearly filtering the contrast normalized input signal with the AMA filter. (b) The model complex cell response is obtained by squaring the linear AMA filter response. (c) The response of an LL neuron, with preferred disparity δk, is obtained by a weighted sum of linear and squared filter responses. The weights can be positive/excitatory or negative/inhibitory (see Figure 7). The weights for an LL neuron with a particular preferred disparity are specified by the filter response distribution to natural images having that disparity (Figure 4a, Equations 4, 5, S1–4). In disparity estimation, the filter responses specify that the weights on the linear filter responses are near zero (see Supplement). (d) A standard disparity energy unit is obtained by simply summing the squared responses of two binocular linear filters that are in quadrature (90° out of phase with each other). Here, we show the tuning curve of a disparity energy unit having binocular linear filters (subunits) with left and right-eye components that are also 90° out of phase with each other (i.e., each binocular subunit is selective for a nonzero disparity).
