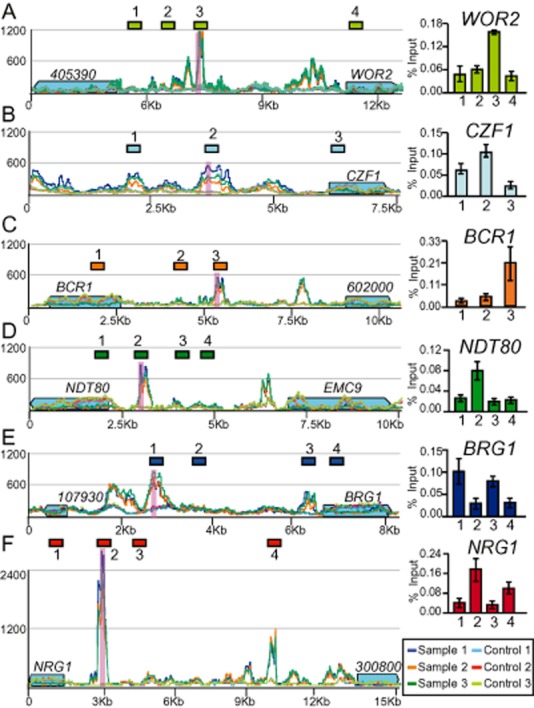
Figure 5.

Binding of Efg1 to intergenic regions. (A)–(F): each represent a different intergenic region, with the coding sequences marked by blue boxes where the arrowhead indicates the direction of transcription. Short gene names are given where possible; long numbers (e.g. 405390) should be preceded by the identifier CPAR2. (A) WOR2/CPAR2_405390; (B) CZF1; (C) BCR1/CPAR_60200; (D) NDT80/ECM9; (E) BRG1/CPAR2_107930; (F) NRG1/CPAR2_300800. The scale shows the coverage range. Different coloured lines indicate the mapped reads from three sample (Efg1-myc) and three control (input) lanes. The peak with the highest summit fold change relative to the input in each intergenic region is indicated in pink. The images were constructed using the Integrative Genomics Viewer (IGV) (Robinson et al., 2011). Sequences within each intergenic region (indicated by numbered coloured boxes) were chosen for analysis by ChIP-PCR. The enrichment of PCR products in immunoprecipitated samples as a % of the input samples is plotted. The average ± standard deviation from three independent measurements is shown.
