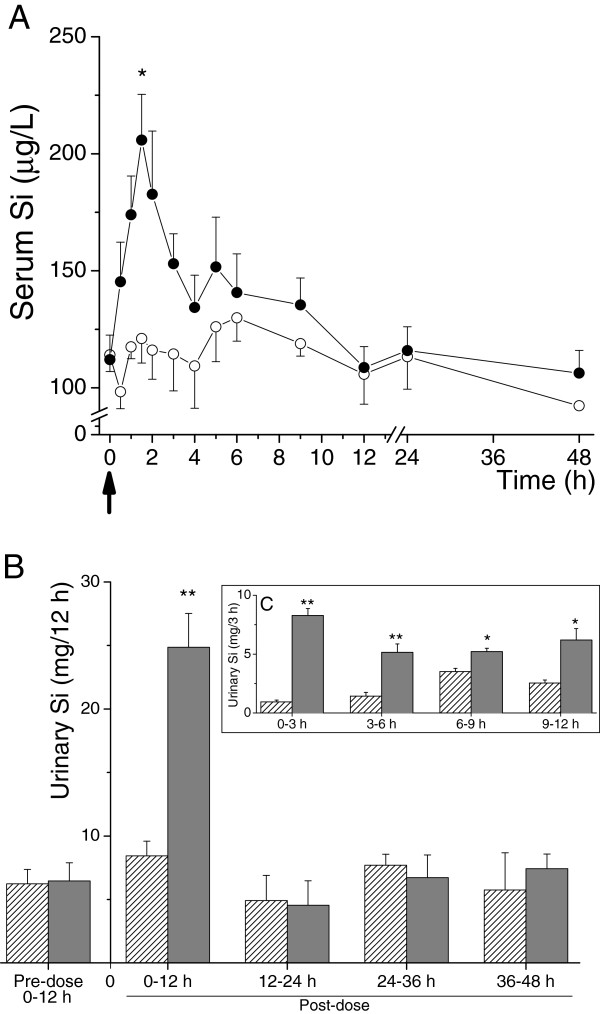
Figure 2.
Serum Si absorption and urinary Si excretion following ingestion of the test solutions. (A) Serum silicon absorption. Serum Si following ingestion of UHP water alone (◯―◯; Control group) or following ingestion of UHP water containing 28.9 mg Si as orthosilicic acid (●―● Si-supplemented group). Data are means ± SE of 6 subjects per group. The large arrow below the x-axis indicates the time of ingestion of the test solutions (i.e. t = 0). *P = 0.009 (Mann–Whitney Rank test). (B and C) Urinary silicon excretion. Urinary excretion of Si following ingestion of UHP water alone (stripped bars; Control group) and UHP water containing 28.9 mg Si as orthosilicic acid (grey bars; Si-supplemented group). (B) Silicon levels in the 12-h urine collections over the 48 h study period. (C) The insert shows more detailed analysis of Si output over the first 12 h following ingestion of the test solutions. Data are means ± SD of 6 subjects per group. *P = 0.009, **P = 0.002 (Mann–Whitney Rank test).

