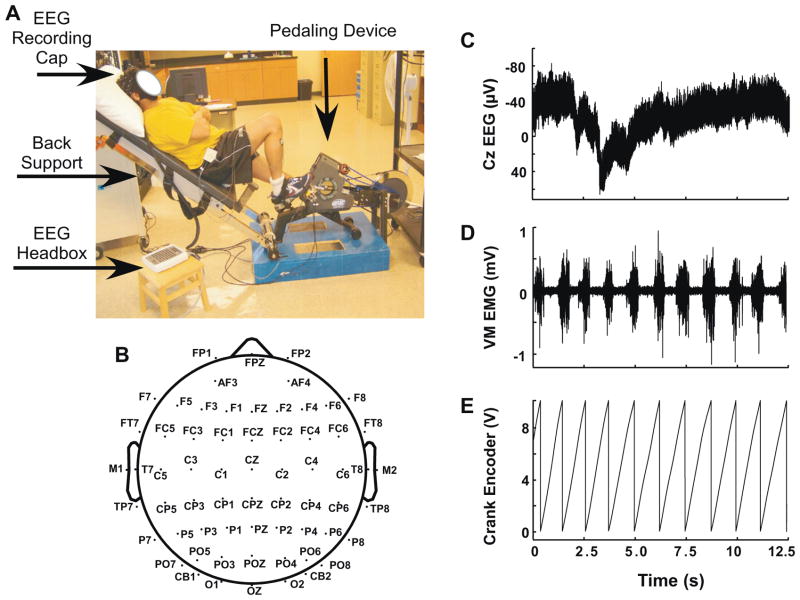
Fig. 1.
(A) Experimental setup: the subject is seated in reclined position in a custom-designed pedaling apparatus with the right leg in the TDC position. (B) Schematic showing the position of the 64 electrodes of the electrode cap (Compumedics Neuroscan, El Paso TX). Note that some electrodes are shown outside the head diagram to indicate their inferior position with respect to the other electrodes. (C) Raw EEG data from one subject recorded at the Cz electrode. This example specifically demonstrates a “worst case” scenario in terms of the drift in the baseline of the signal (note the long timescale). (D) Raw EMG data from one subject recorded at right MH muscle. EMG bursts were typically observed with each pedaling cycle. (E) Voltage data recorded from crank encoder representing crank angle during pedaling. The encoder signal was reset at TDC for the right leg. Figures c–e illustrate raw data for ~11 pedaling cycles.

