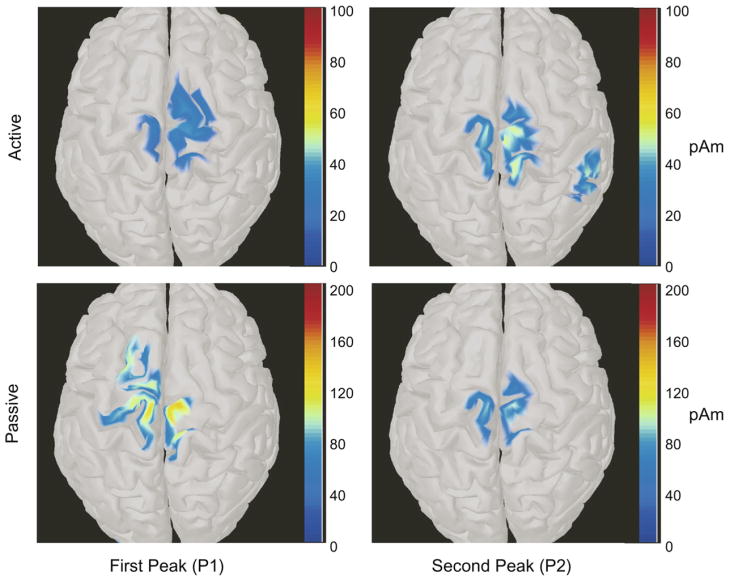
Fig. 3.
Distributed current source maps were calculated at timepoints associated with P1 and P2 for the group averaged active and passive conditions (See Fig. 2) using Brainstorm software. The calculated current dipole moments are displayed on a standard brain surface. The threshold level for current density was set to display only the regions with the highest current magnitudes (Active P1: 20pAm, Active P2: 25pAm, Passive P1: 70pAm, Passive P2: 60pAm). In all cases, the highest current values were obtained in the regions of the primary somatosensory and motor cortices, consistent with somatotopic regions traditionally associated with the legs.

