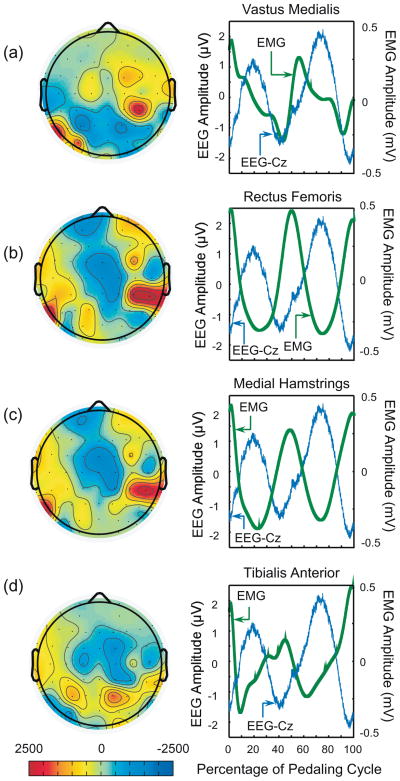
Fig. 4.
2-D topographic maps showing the cross correlation (non-normalized, zero time lag) between the ensemble averaged EEG and the composite EMGs from the VM, RF, MH and TA muscles (left panels in figures a–d respectively) during active pedaling. The 2-D maps were created by interpolating the correlation obtained at each of the 64 electrodes over the scalp. These 2-D topographic maps were generated using EEGLAB. The right panels show the EEG waveform at the Cz electrode and the composite EMGs from the VM, RF, MH and TA muscles.

