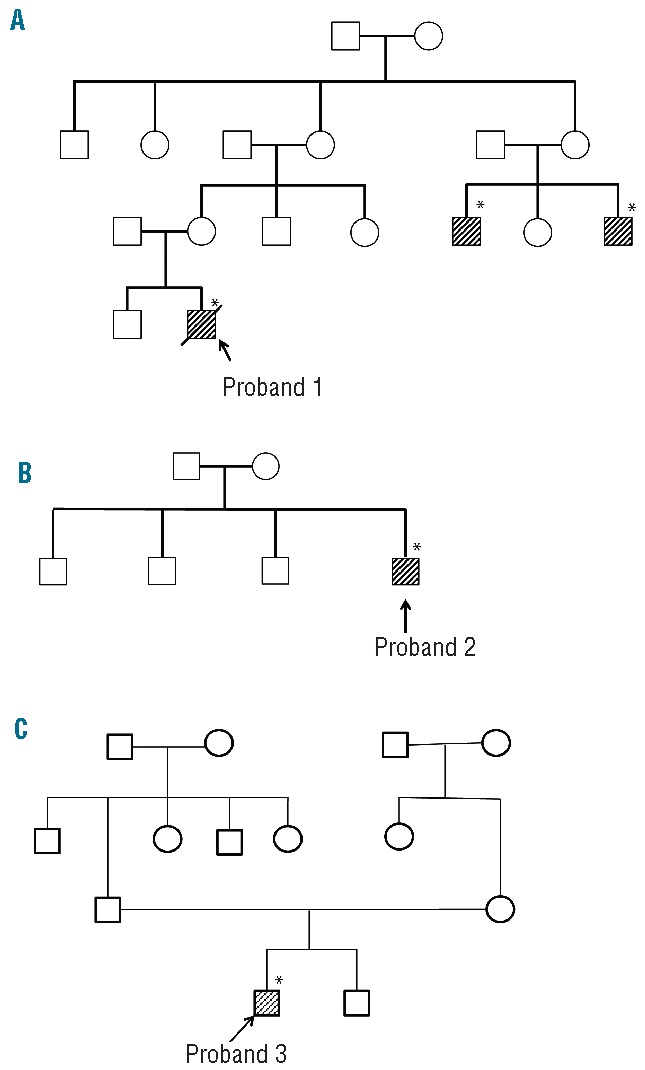
Figure 3.

Family trees of three unrelated probands. Family tree of: (A) proband 1 with XLSA, (B) proband 2 with nfCSA, and (C) proband 3 with nfCSA. Shaded boxes indicate affected individuals in each pedigree. Asterisks indicate the individuals in whom a mutation in the first intron of the ALAS2 gene was detected.
