
Figure 4.
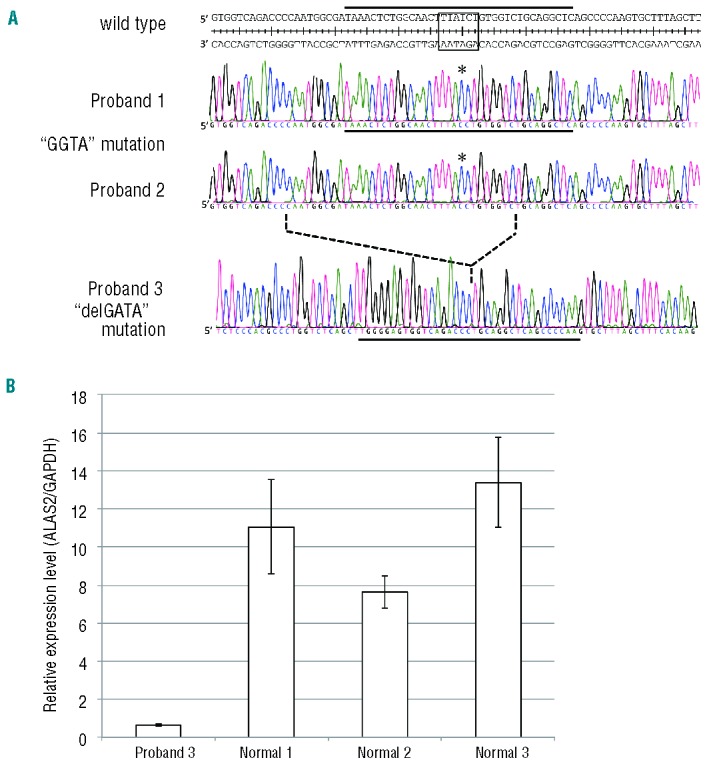
Identification of mutations in the first intron of the ALAS2 gene in a patient with XLSA and two patients with nfCSA. (A) ALAS2 mutations in three probands. Upper, middle and lower panels show the sequences of the flanking regions of ALAS2int1GATA (boxed in the wild-type sequence) in the ALAS2 gene of probands 1, 2 and 3, respectively. Asterisks indicate the T to C transition in the sense strand identified in the ALAS2 gene of proband 1 and proband 2 with CSA. The broken line between the middle and lower panels indicates the deleted region identified in proband 3 with CSA. The solid horizontal bar in each panel indicates the sequence of the sense strand of each probe used for the EMSA (see Figures 3A and 5B). (B) ALAS2 mRNA expression in erythroblasts of proband 3. ALAS2 mRNA levels were determined in purified erythroblasts isolated from proband 3 and three independent normal individuals using real-time PCR. Results are expressed as the mean ± SD of three independent experiments.