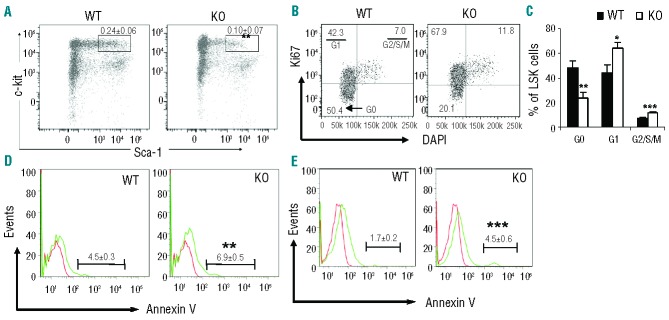
Figure 1.

Analysis of frequency, proliferation and apoptosis of LSK cells. (A) Flow cytometric analysis of LSK cells. BM cells were isolated from wild type (WT) and IEX-1 KO mice and subjected to flow cytometric analysis after staining with antibodies against various lineages, c-Kit, and Sca-1. The numbers in the plot are mean percentages ± standard deviation (SD) of LSK cells relative to total BM cells (n = 7). (B and C) Cell cycle analysis within LSK cells using DAPI and anti-Ki67 antibody. The numbers in the plot are percentages of LSK cells at G0, G1 and G2/S/M phases as indicated and data from 7 mice are summarized in (C). (D and E) FACS histograms of apoptotic cells in total BM (D) and LSK cells (E). The numbers in the plot are mean percentages ± SD of Annexin-V+ cells in total BM cells or LSK cells. *, ** and ***, P<0.05, 0.01 or 0.001, respectively, in the presence versus absence of IEX-1.
