
Figure 3.
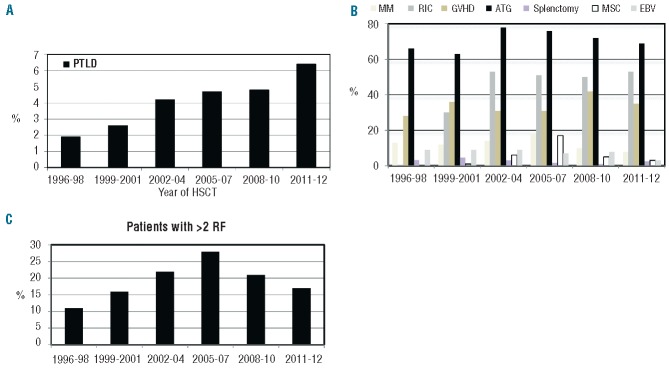
Incidence of PTLD and frequencies of risk factors over time. (A) Incidence of PTLD in percentage divided in the indicated time periods. (B) The frequency of identified risk factors (RF) in the patients during the indicated time periods. Chosen risk factors were found to be statistically significant in multivariate analysis. MM denotes HLA mismatch; RIC, reduced intensity conditioning; GVHD, graft-vs.-host disease grade II–IV; MSC, mesenchymal stromal cell treatment; EBV, EBV serology mismatch. (C) The frequency of patients with more than two risk factors in the indicated time periods.