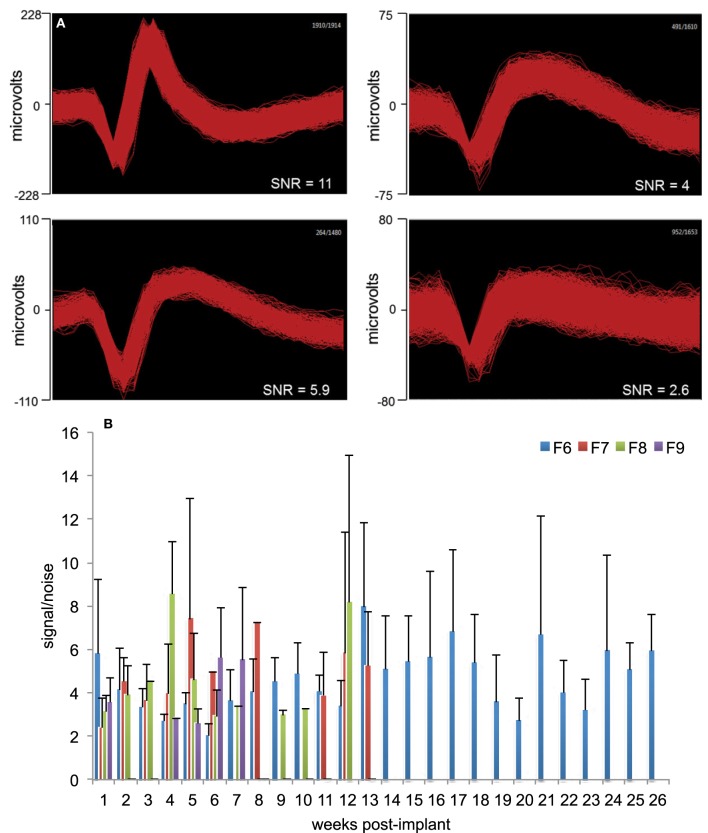
Figure 2.
Signal quality and SNR. (A) Representative offline sorted waveforms isolated from individual electrodes to depict signal quality. High (>5), medium (3–5), and low SNR (<3) waveforms are shown. In general, SNR values were in the range 3–6. Waveforms are shown within a 1.2 ms time-window. (B) Weekly signal-to-noise levels for animals F6, F7, F8, and F9 are shown. SNR values were comparable to those reported earlier by other studies. SNR values were not dependent upon implant durations or daily changes in impedance values.

