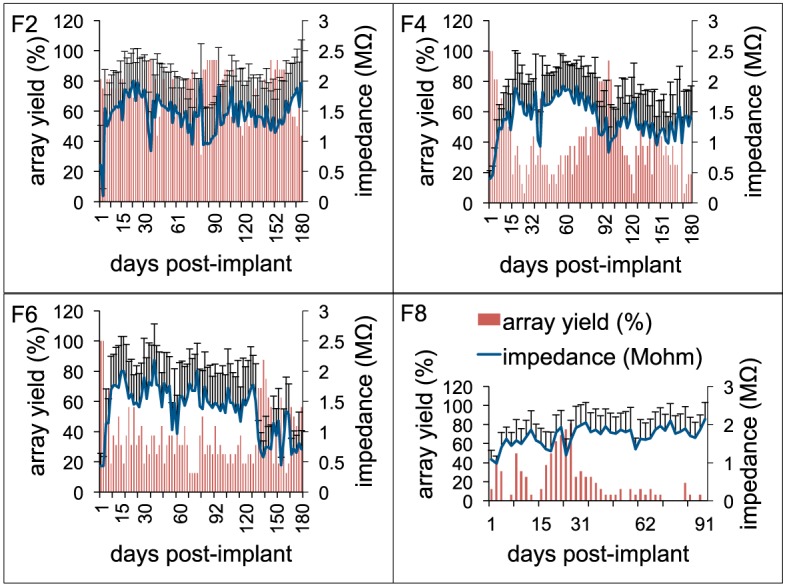
Figure 6.

Electrode impedance and electrophysiology trends. Daily array yield (red) and average 1 KHz impedance trends (blue) for four long-term animals (F2, F4, F6: 6-months; F8: 3-months) to show the large daily variations in electrode impedance that result in low array yield. Array yield was defined as the percentage of electrodes out of 16 electrodes in an array that was able to isolate at least a single neuron during a recording session. Error bars depict standard deviations among the impedance values recorded from 16 electrodes during a recording session.
