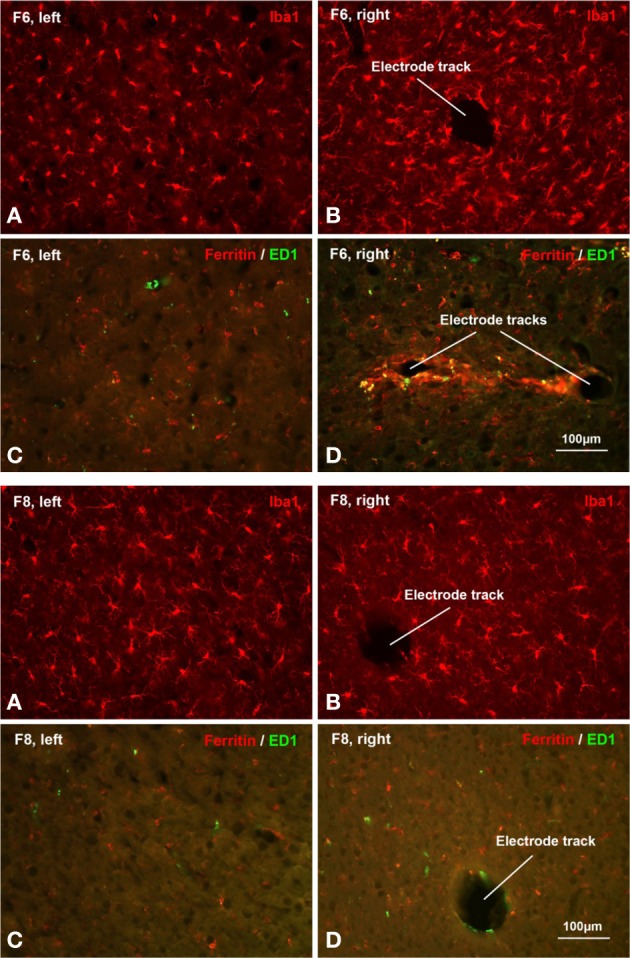
Figure 7.

Histopathology. Histopathological staining of microglial cells in two chronically implanted animals, F8 (91 days, top panel) and F6 (180 days, bottom panel). In F8, poor electrode array yield was correlated with minimal microglial activation. Comparing Iba1 labeling on the non-implanted contralateral side (A) with the implanted side (B) it is evident that microglia display a characteristic resting morphology as well as similar density on both sides. There was only modest upregulation of ED1 and ferritin expression in F8, as seen in Table 2 and in panels (C,D). In F6, a moderate-to-good array yield correlated with minimal microglial activation. Comparing panels (A,B) microglia appear slightly hypertrophic and somewhat increased in number. Ferritin expression was upregulated modestly and to a similar extent as in F8 (Table 2). Panel (D) shows an example of the maximal ferritin upregulation observed around electrode tracks in this animal.
