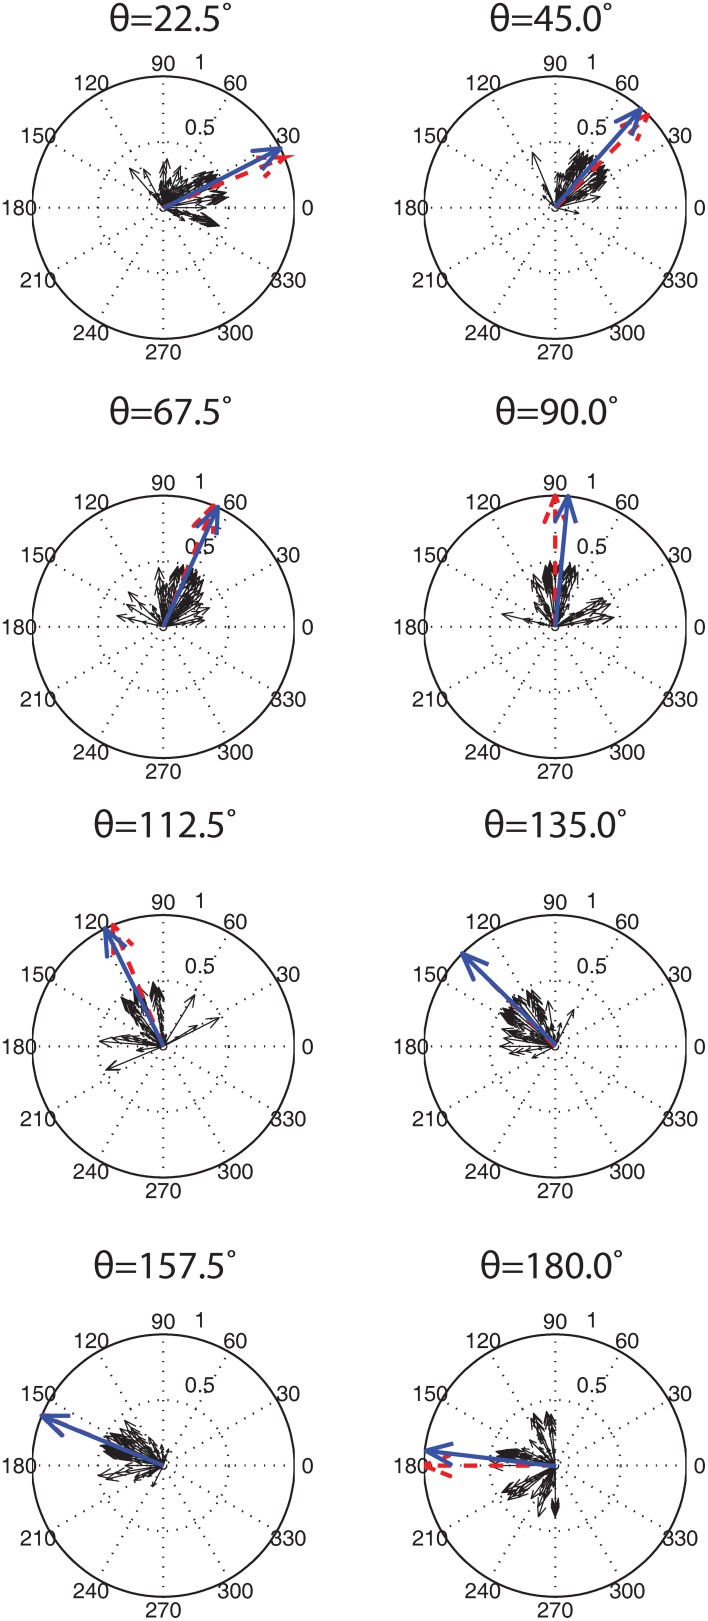
Figure 10.
Population decoding of eight test presentation angles. The test presentation angle θ, is shown above each population decoding figure. 100 simulation runs, each with identical parameter values but different training presentation orders, were conducted and the firing rates of the Exc group neurons were recorded. The individual responses of each of the 400 neurons (4 Exc neurons × 100 runs) are shown with solid black arrows. These individuals were summed to give a population vector (shown with a blue arrow) that was compared to the correct presentation angle (shown with a red arrow). Both the population vectors and correct presentation angle vectors were normalized while the component vectors were scaled down by a factor of 2 for display purposes (see text for details).

