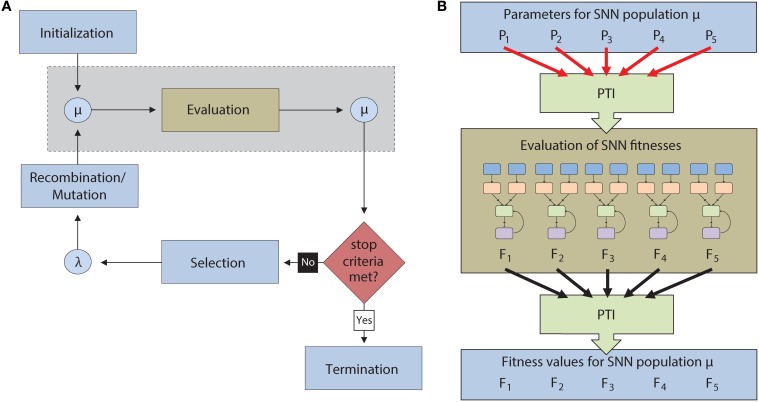
Figure 2.
(A) Flow chart for the execution of an Evolutionary Algorithm (EA). A population of individuals (μ) is first initialized and then evaluated. After evaluation, the most successful individuals are selected to reproduce via recombination and mutation to create an offspring generation (λ). The offspring then become parents for a new generation of the EA. This continues until a termination condition is reached. The light blue boxes denote operations that are carried out serially on the CPU while the light brown box denotes operations carried out in parallel on the GPU. The operations inside the dotted gray box are described in greater detail in (B). (B) Description of the automated parameter tuning framework consists of the CARLsim SNN simulator (light brown), the EO computational framework (light blue), and the Parameter Tuning Interface (PTI) (light green). The PTI passes tuning parameters (PN) to CARLsim for evaluation in parallel on the GPU. After evaluation, fitness values (FN) are passed from CARLsim back to EO via the PTI.

