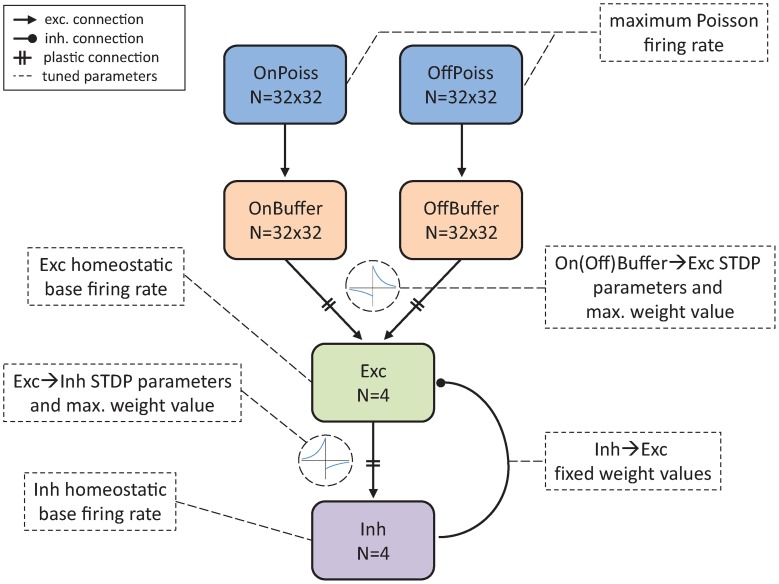
Figure 3.
Network architecture of the SNN tuned by the parameter tuning framework to produce V1 simple cell response and SORFs. N represents the number of neurons used in different groups. E → E and E → I STDP curves are included to describe plastic On(Off)Buffer → Exc and Exc → Inh connections. Tuned parameters are indicated with dashed arrows and boxes.

